June 9
Friday's employment report showed a remarkable increase in Leisure and Hospitality employment. That raised a useful question: were we missing an important signal in the business formation data? A rainy Seattle day provided the perfect excuse to improve RainbowStats' spectral analysis tools.
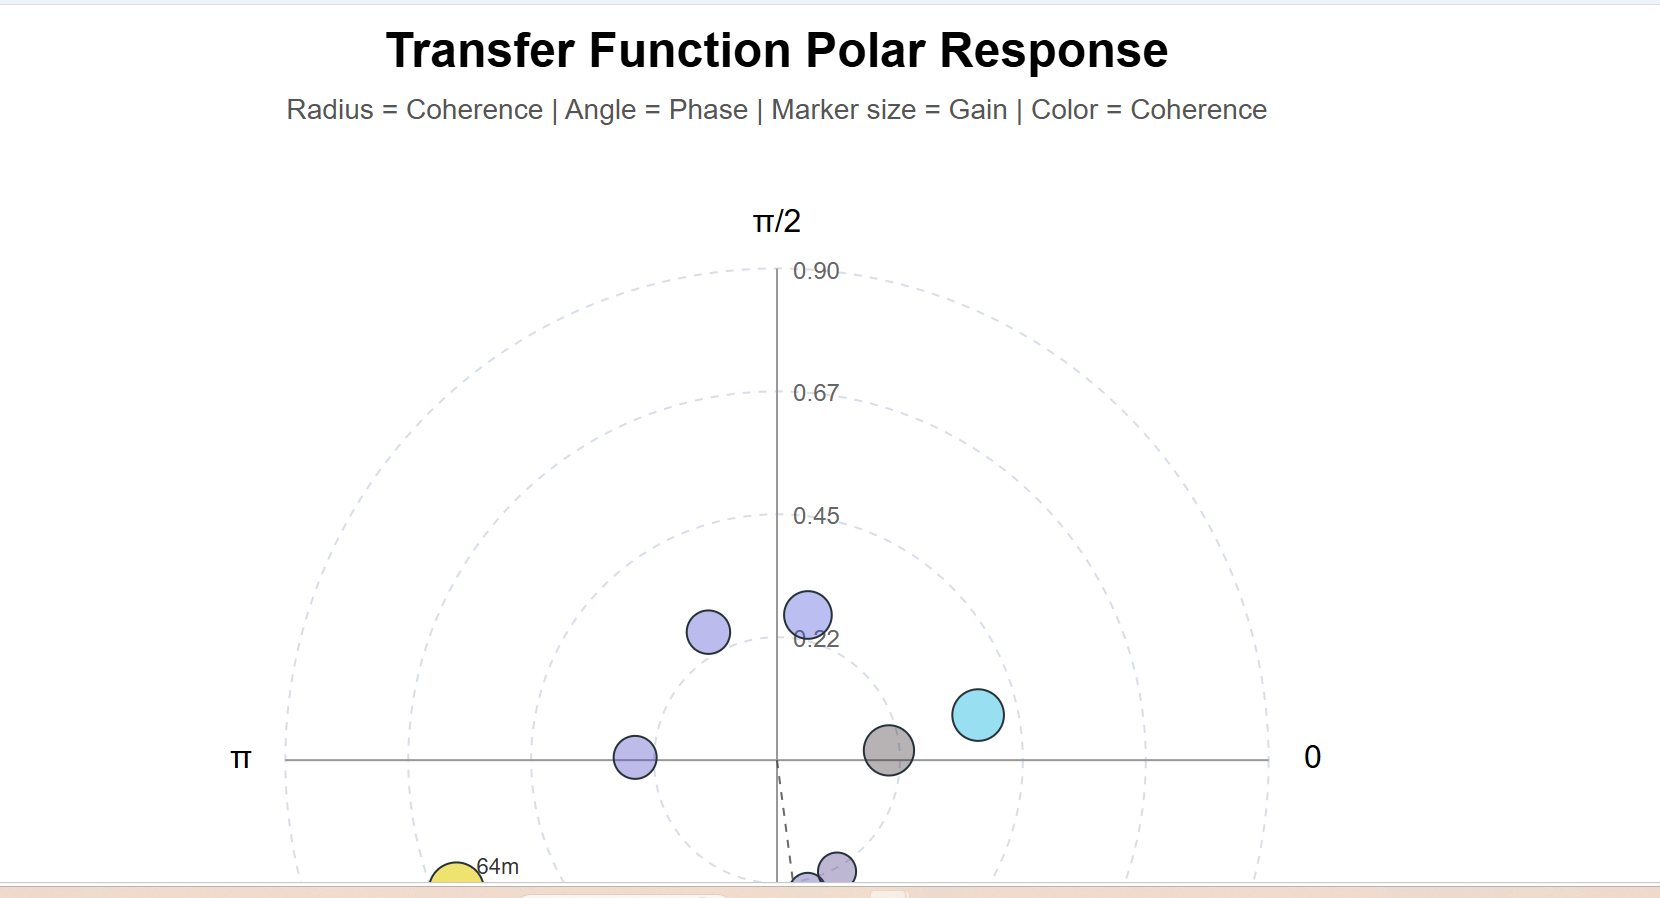
Using a new polar-coordinate transfer-function visualization, I examined the relationship between U.S. Business Applications and Nonfarm Payroll Employment.
The result was striking. The analysis found an exceptionally strong relationship at the 8-month cycle frequency, with coherence near 0.90. That suggests business formation and hiring are tightly linked at short economic horizons, consistent with the idea that new business creation often precedes employment growth.
The polar chart combines three pieces of information in one visualization:
This makes it easier to see not only whether two series are related, but also where in the business cycle the relationship is strongest and whether one series tends to lead the other.
polar_transfer_function(BUSAPPWNSA,PAYEMS)Once again, the full analysis required just a single line of RainbowStats scripting code.
Run the analysis in RainbowStats
Tags: Economics, Employment, Jobs, Entrepreneurship, Small Business, Data Science, Statistics, Spectral Analysis, D3.js, FRED, Data Visualization, FinTech