R-star: A Useful Concept, an Uncertain Number
Two respected models differ by about 64 basis points, real-time revisions can be just as large—and a market-based RainbowStats estimate contradicts both models.
Replicate the analysis in RainbowStats →R-star is one of the most influential numbers in monetary policy and one of the few important numbers that no one can observe. It is usually defined as the real short-term interest rate consistent with stable inflation and an economy operating near potential. If the actual real policy rate is above R-star, policy is restrictive; if it is below R-star, policy is accommodative.
That sounds precise. The measurement is not. R-star must be inferred from models whose crucial inputs—potential output, trend growth and economic slack—are themselves unobservable and revised. The proper response is not to abandon the concept. It is to stop pretending that one model's decimal point is a fact.
Two models, two answers
The Laubach-Williams model is a U.S. state-space model. Holston-Laubach-Williams extends the framework internationally, allowing common global forces to influence national neutral rates. Both are serious models. Both are maintained by serious economists. Yet they currently give meaningfully different answers.
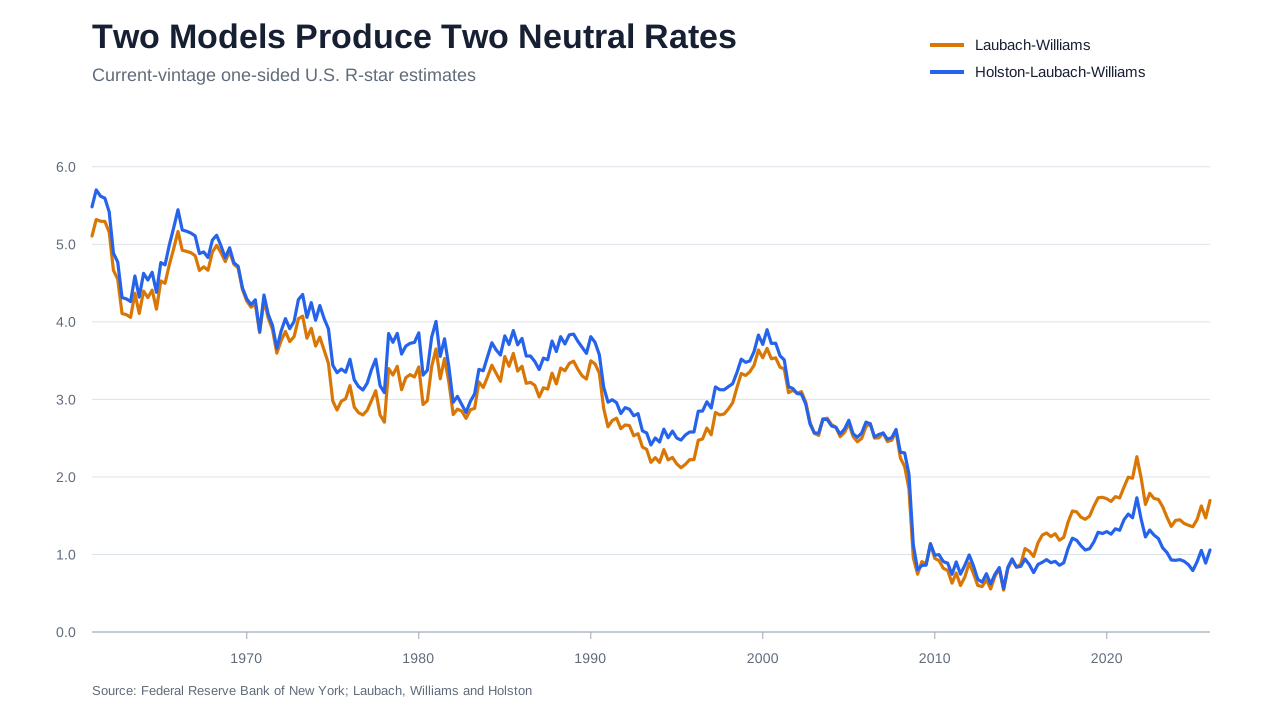
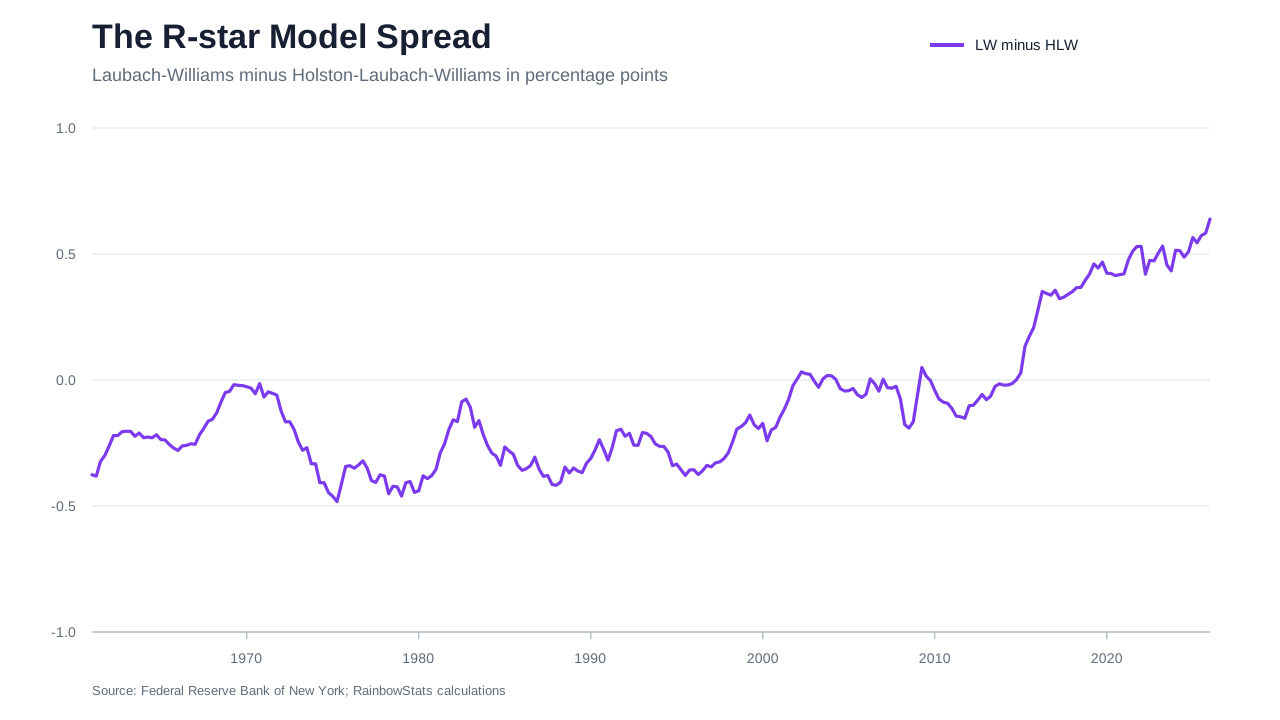
Since 2022Q4, the LW estimate has exceeded HLW in every quarter. The average difference is 52 basis points. This is not a rounding error. A 50-to-65-basis-point difference can materially change the conclusion about how restrictive monetary policy is.
The stronger test is real time
Current historical estimates enjoy hindsight. They incorporate revised data, additional observations and sometimes re-estimated parameters. Policymakers do not enjoy that luxury. They must act on the terminal one-sided estimate available at the time.
The HLW real-time workbook lets us reconstruct that experience. We take the final U.S. observation from every vintage and compare it with the later estimate for the same quarter. Because the model changed after the pandemic, we make the comparison within model regimes: vintages through 2020Q2 are compared with the final legacy-model vintage, and vintages beginning in 2022Q4 are compared with the latest post-COVID specification.
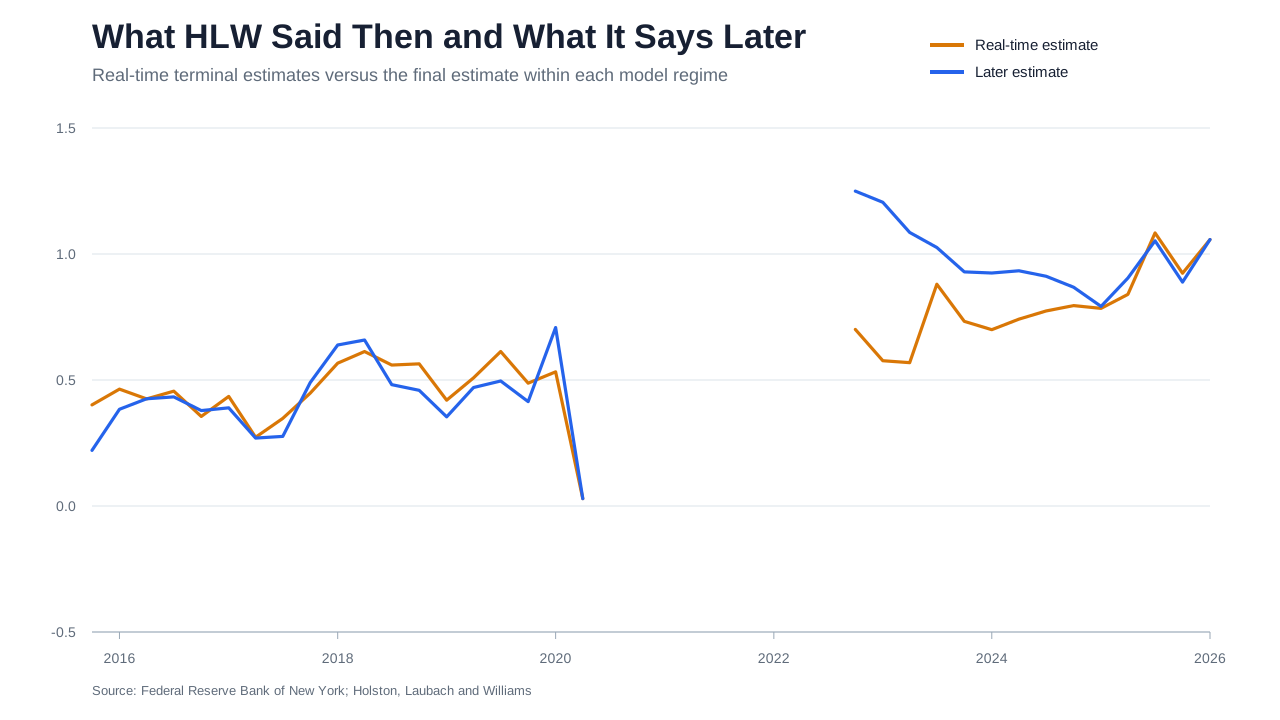
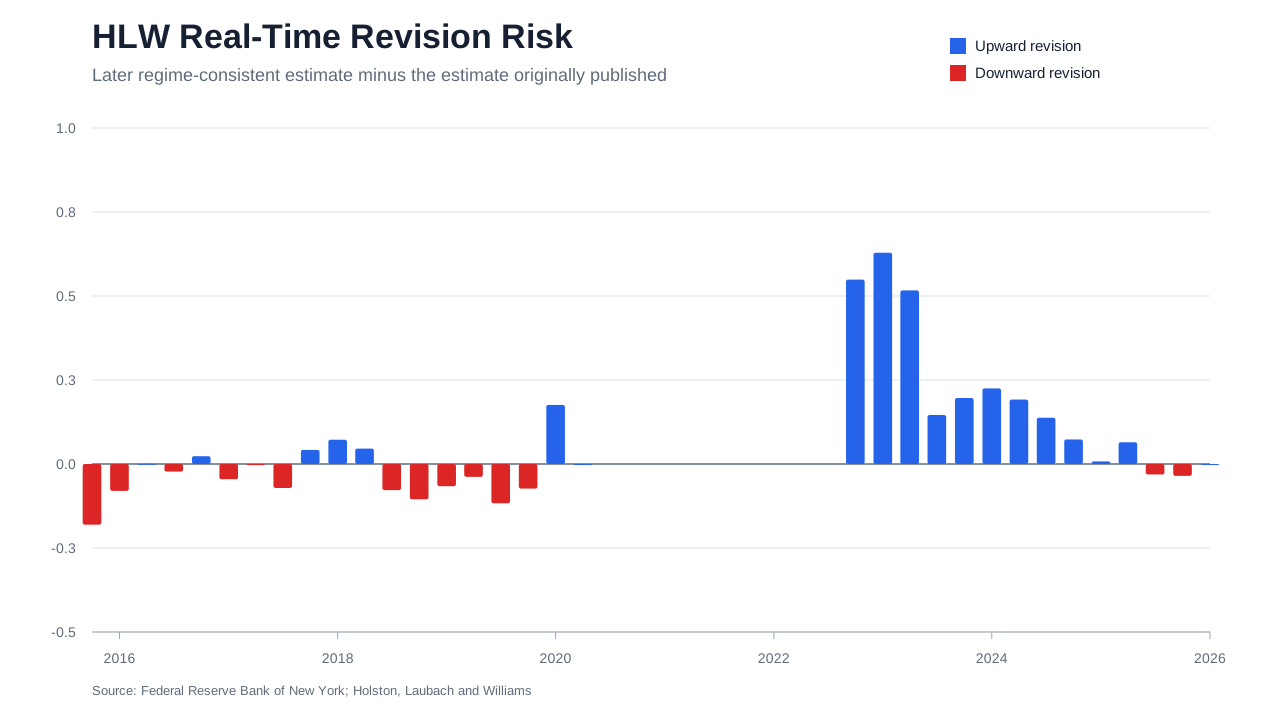
For post-COVID vintages, the mean absolute revision is 20 basis points and the revision RMSE is 29 basis points. The largest is 2023Q1: an upward revision of 63 basis points. The estimate initially published for 2023Q1 was 0.58 percent; the 2026Q1 vintage puts that quarter at 1.21 percent.
The current disagreement between LW and HLW is almost exactly as large as the biggest recent real-time HLW revision.
That is the central skeptical result. There are two distinct uncertainties: model uncertainty, because equally respectable specifications disagree, and revision uncertainty, because the estimate available to a policymaker can change substantially after the fact.
A constructive estimate—and a contradiction
Skepticism is cheap if it produces no alternative. We therefore construct a transparent RainbowStats Market R-star from observable Treasury Inflation-Protected Securities yields.
This is a simple approximation to the five-year real interest rate beginning five years in the future—the 5Y5Y real forward rate. Looking beyond the next five years reduces the direct influence of the current business cycle and near-term monetary policy. We calculate it daily and take quarterly averages.
The estimate is independent of the hidden-state assumptions in LW and HLW. It is also forward-looking: it changes as investors revise their view of long-run real returns. Most important, it does not confirm the models' current message. It contradicts it.
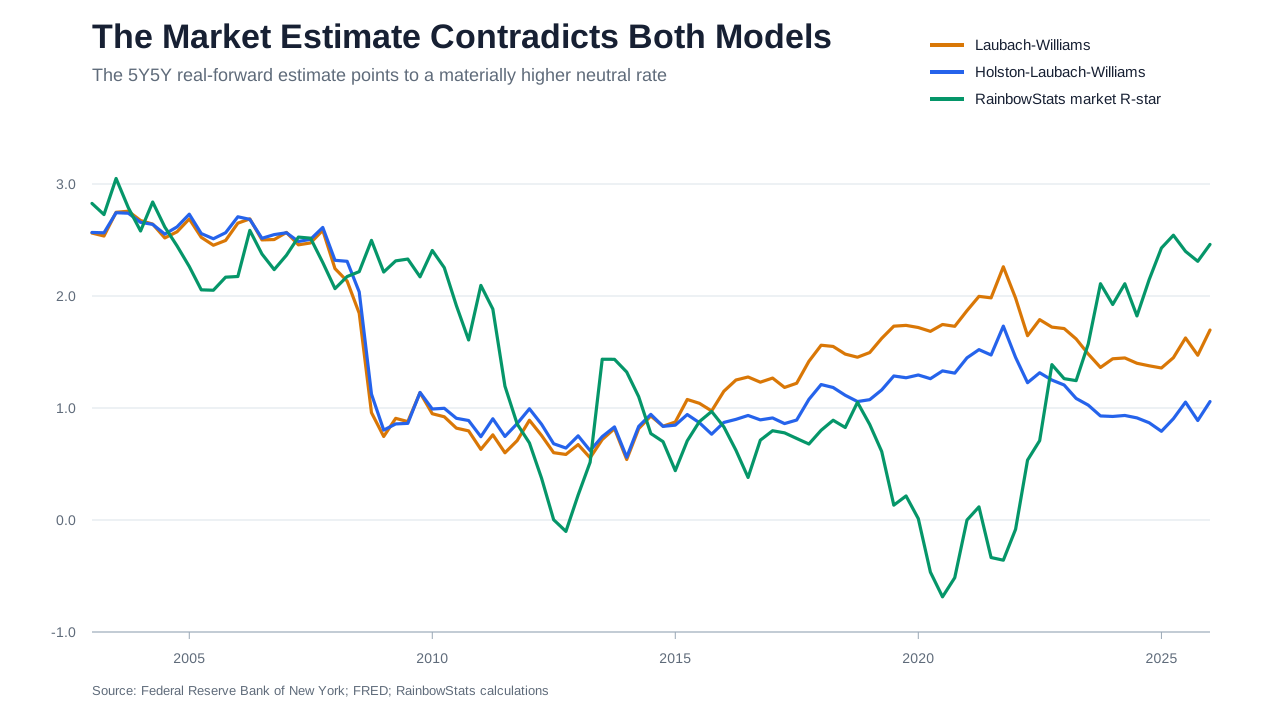
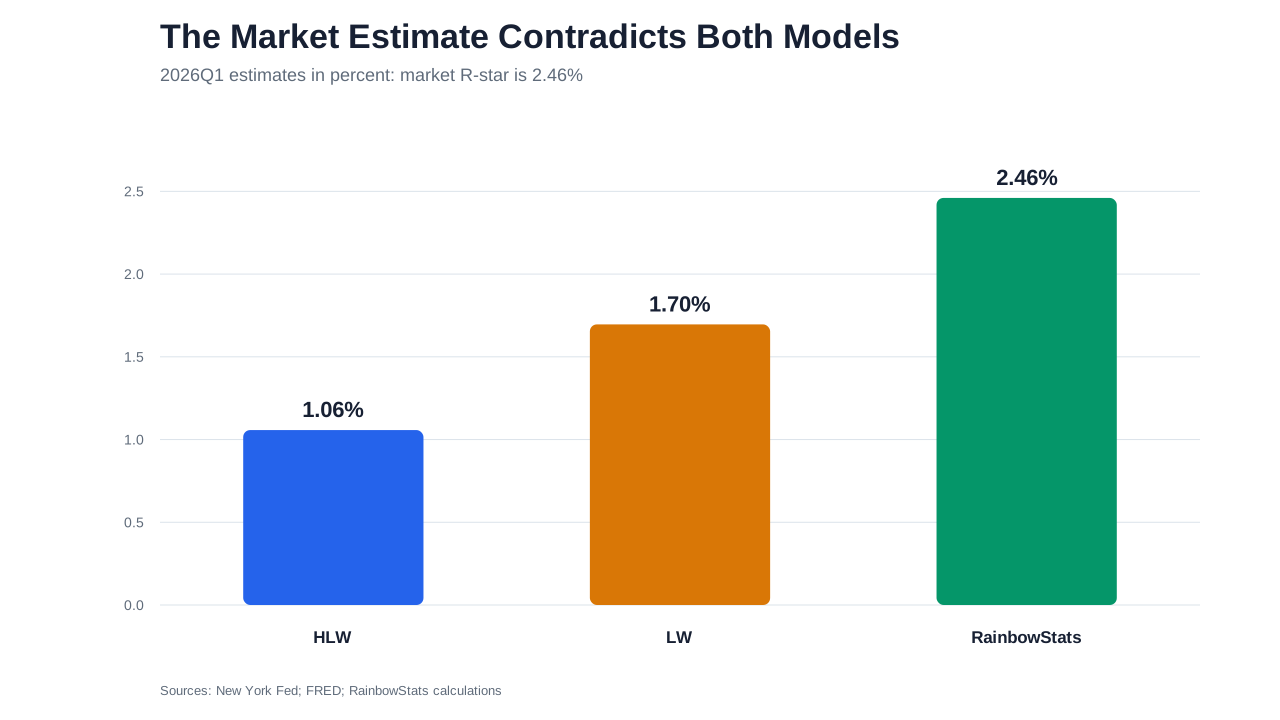
For 2026Q1, our market estimate is 2.46 percent—about 76 basis points above LW and 140 basis points above HLW. This is not a minor disagreement around a common center. The observable forward real-rate market is describing a substantially higher long-run real-rate environment than either state-space model.
If the market measure is closer to the truth, monetary policy is less restrictive than an LW or HLW comparison would suggest. If the models are closer to the truth, the 5Y5Y real-forward rate must contain an unusually large real term premium or another persistent distortion. Either explanation is economically important. The contradiction is therefore evidence, not noise to be averaged away.
What our estimate gets right
- It is observable, reproducible and updated from public market data.
- It does not require an estimated output gap or an unobserved productivity trend.
- It is forward-looking and less exposed to current-quarter cyclical conditions.
- Its assumptions are visible enough to criticize.
What it does not solve
- TIPS yields contain a real term premium.
- TIPS liquidity can differ from nominal Treasury liquidity.
- The formula uses constant-maturity par yields, so the 5Y5Y calculation is an approximation rather than an exact zero-coupon forward rate.
- Markets can be wrong collectively just as models can be wrong statistically.
A range, not a point
R-star remains a useful organizing concept. It forces policymakers to distinguish nominal from real rates and to ask whether policy is pushing demand above or below sustainable supply. But usefulness does not confer observability.
We should therefore report a range of estimates and the sources of disagreement. Persistent agreement among LW, HLW and the market benchmark would be stronger evidence than any one series. A widening spread should be treated as evidence that uncertainty has increased—not as an invitation to select the estimate that best supports a preferred policy.
The RainbowStats market measure is Version 1. The natural next refinement is to subtract a public estimate of the real term premium and test whether the adjusted series improves forecasts of inflation, output growth and subsequent policy normalization. That gives us a falsifiable research program rather than a rhetorical objection.
Run the complete analysis in RainbowStats →
View the core RainbowStats script
vixcls;
lw=READ_JSON_SERIES("https://rainbowstats.com/data/lw_current_estimates.json","LW_US_RSTAR_ONE_SIDED");
lw=set_name(lw,Laubach_Williams_Rstar);
hlw=READ_JSON_SERIES("https://rainbowstats.com/data/hlw_real_time_estimates.json","HLW_US_RSTAR_LATEST_ONE_SIDED");
hlw=set_name(hlw,Holston_Laubach_Williams_Rstar);
modelSpread=set_name(lw-hlw,LW_Minus_HLW);
realTime=READ_JSON_SERIES("https://rainbowstats.com/data/hlw_real_time_estimates.json","HLW_US_RSTAR_REAL_TIME");
realTime=set_name(realTime,HLW_Real_Time_Estimate);
regimeFinal=READ_JSON_SERIES("https://rainbowstats.com/data/hlw_real_time_estimates.json","HLW_US_RSTAR_REGIME_FINAL_FOR_REALTIME_DATES");
regimeFinal=set_name(regimeFinal,HLW_Later_Estimate);
revision=READ_JSON_SERIES("https://rainbowstats.com/data/hlw_real_time_estimates.json","HLW_US_RSTAR_REGIME_REVISION");
revision=set_name(revision,HLW_Revision);
realForwardRaw=set_name(2*DFII10-DFII5,RainbowStats_5Y5Y_Real_Forward);
marketRstar=set_name(AGGREGATE_TO_PERIOD(realForwardRaw,QUARTERLY,MEAN),RainbowStats_Market_Rstar);
modelChart=add_subtitle(set_title(line_chart(lw,hlw),"Two Models Produce Two Neutral Rates"),"Current-vintage one-sided estimates from the LW and HLW models");
spreadChart=add_subtitle(set_title(line_chart(modelSpread),"The R-star Model Spread"),"Laubach-Williams minus Holston-Laubach-Williams in percentage points");
vintageChart=add_subtitle(set_title(line_chart(realTime,regimeFinal),"What HLW Said Then and What It Says Now"),"Real-time terminal estimates versus the final estimate within each model regime");
revisionChart=add_subtitle(set_title(line_chart(revision),"HLW Real-Time Revision Risk"),"Later regime-consistent estimate minus the estimate originally published");
marketComparison=same_date_range(list(lw,hlw,marketRstar));
marketChart=add_subtitle(set_title(line_chart(marketComparison),"Three Independent Views of R-star"),"LW and HLW compared with the RainbowStats 5Y5Y real-forward estimate");
slideshow(modelChart,spreadChart,vintageChart,revisionChart,marketChart);