Artificial intelligence is not financed by enthusiasm alone. Servers must be ordered, software must be built, power must be secured, receivables must be carried, and suppliers must be paid. Those commitments create a financing problem long before every project settles into a corporate balance sheet.
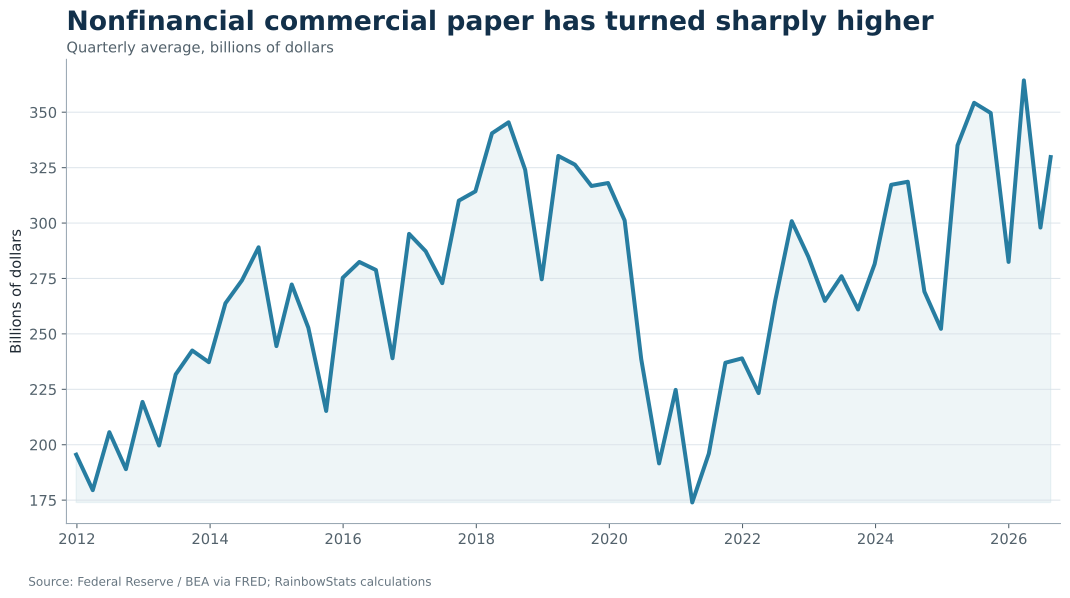
That makes the recent rise in nonfinancial commercial paper more interesting than it first appears. Commercial paper is unsecured, short-term corporate funding. It can bridge the period between an investment commitment and permanent financing, or fund the working capital created by a rapidly expanding supply chain. If AI investment is beginning to affect credit markets, commercial paper is one logical place to look.
The commercial-paper rise is real
The outstanding stock of nonfinancial commercial paper has moved sharply higher, even as the usual macroeconomic explanations have been unconvincing. We first tested C&I lending, capacity utilization, M2 velocity, real GDP growth and inventory accumulation on a common quarterly grid.
The recent 24-quarter regression using C&I lending growth, real GDP growth and inventory accumulation explained only about 9% of quarterly CP growth; its adjusted R² was negative. Real GDP and current bank lending were statistically insignificant. Inventory accumulation mattered over the full history, but not during the recent cycle.
A publishable proxy for the AI investment cycle
A proprietary AI stock index would be the obvious market proxy, but it introduces two problems. First, branded indexes can carry licensing and republication restrictions. Second, an equity index measures valuation, sentiment and discount rates as much as physical investment.
We therefore use the Bureau of Economic Analysis series for private investment in information-processing equipment and software. It is government-sourced, quarterly, reproducible and directly connected to servers, computing equipment and software. It is not a pure AI measure, so throughout the analysis it is labeled an AI-capex proxy, not an AI index.
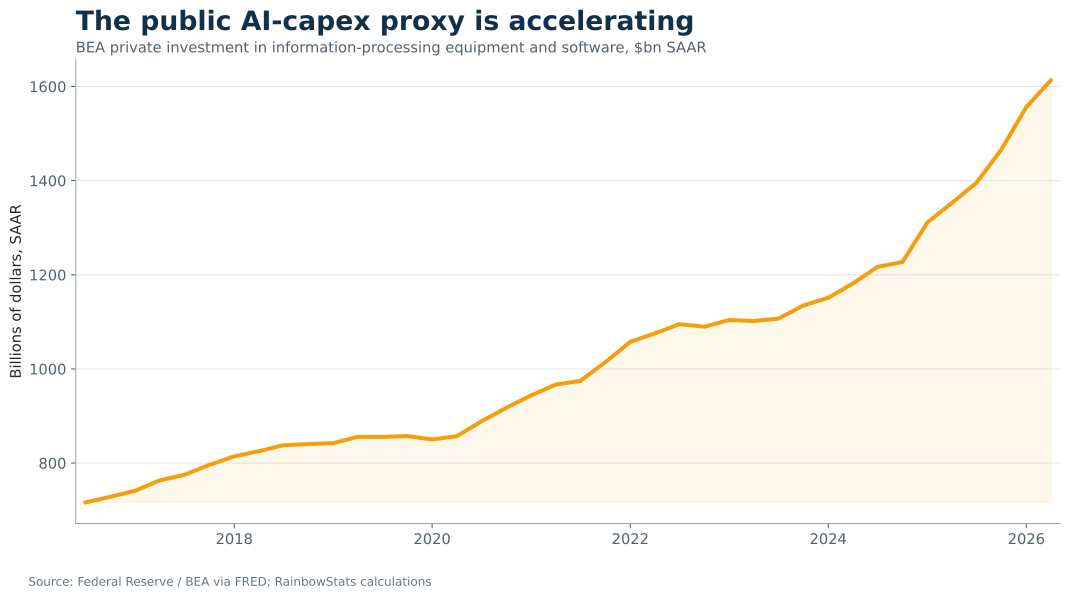
This is a deliberately broad proxy. It captures non-AI technology investment too. Yet that breadth is useful: the financing consequences of AI do not stop with companies carrying an “AI” label. The buildout reaches equipment manufacturers, software firms, utilities, contractors, data-center suppliers and the working capital of the entire chain.
Same-quarter correlation misses the mechanism
A contemporaneous regression of quarterly commercial-paper growth on growth in the AI-capex proxy produces almost no explanatory power: R² is approximately 0.002. That initially looks disappointing. Economically, however, it makes sense. Investment plans, equipment orders and construction commitments need not coincide with the quarter in which short-term funding is issued.
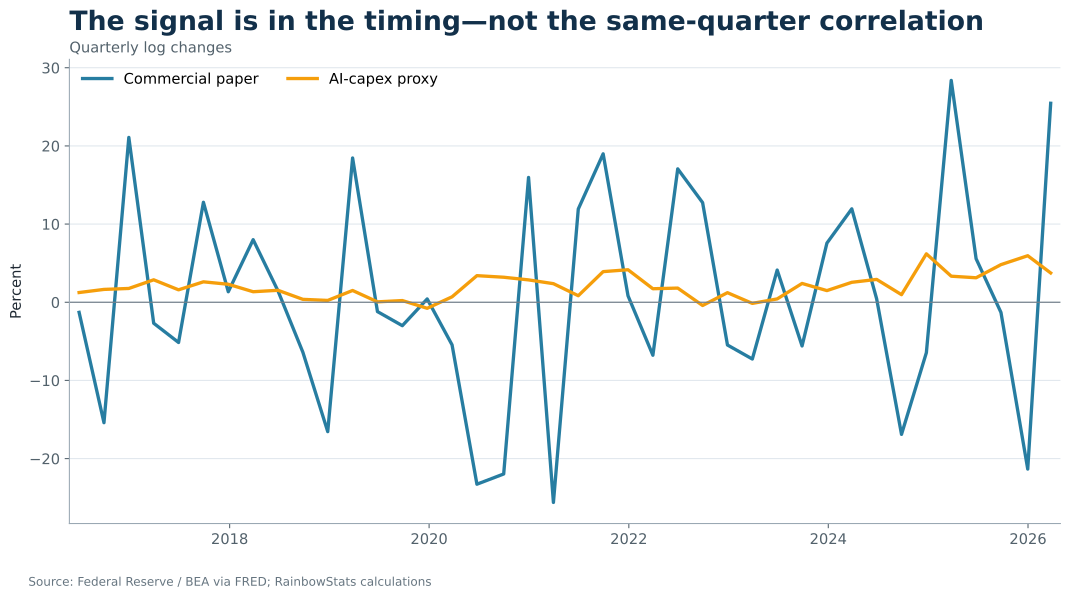
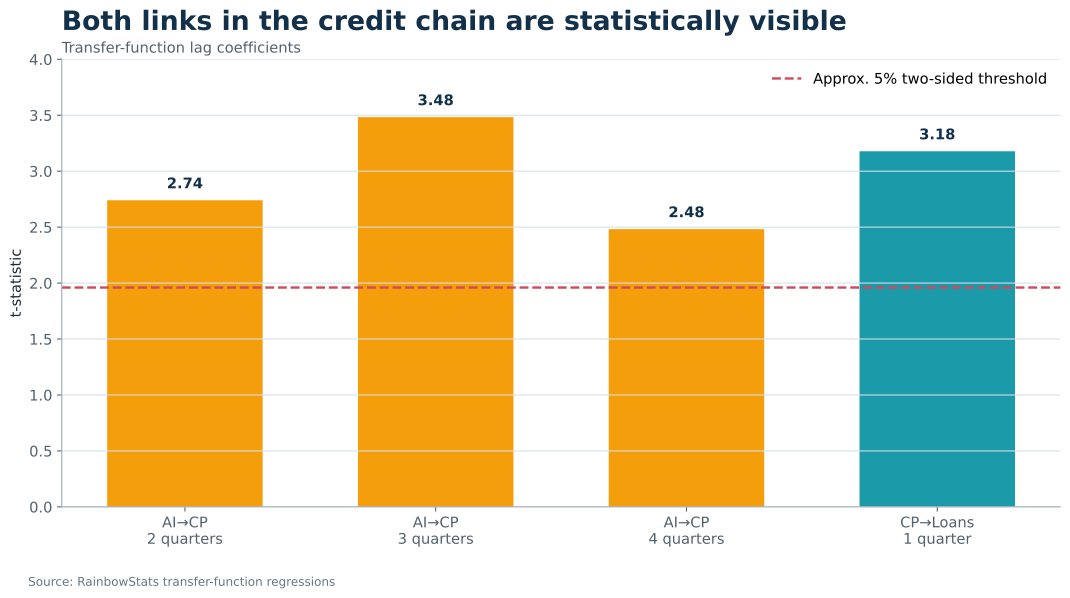
The transfer function changes the result. After filtering the serial structure of both series, AI-capex growth at lags two, three and four quarters is positive and statistically significant. The strongest coefficient occurs at three quarters. Together, the selected lags explain about 24% of filtered commercial-paper growth.
| Relationship | Lag | Coefficient | t-stat | Model R² |
|---|---|---|---|---|
| AI capex → commercial paper | 2 quarters | 2.216 | 2.74 | 0.237 Adj. 0.189 |
| AI capex → commercial paper | 3 quarters | 2.852 | 3.48 | |
| AI capex → commercial paper | 4 quarters | 2.064 | 2.48 | |
| AI capex → commercial paper | 9 quarters | 1.801 | 2.21 | |
| Commercial paper → C&I loans | 1 quarter | 0.076 | 3.18 | 0.106 Adj. 0.085 |
The two-to-four-quarter cluster is the economically persuasive result. The nine-quarter term may capture a slower investment cycle, but because lag selection is exploratory it should be treated cautiously rather than promoted as a separate causal claim.
From commercial paper into the banking system
The second link is cleaner. Filtered commercial-paper growth predicts C&I lending growth one quarter later with a coefficient of 0.076 and a t-statistic of 3.18. The residual cross-correlation is strongest contemporaneously at 0.332, while the lag regression shows that the CP impulse carries into subsequent bank lending.
impulse
bridge
lending
The multivariate transfer function strengthens that interpretation. When bank-lending growth is modeled jointly against commercial-paper growth and the AI-capex proxy, commercial paper remains significant with a coefficient of 0.077 and a t-statistic of 3.40. The AI proxy is not selected once CP is included. That is the pattern one would expect if commercial paper is an intermediate channel: the investment impulse reaches CP first, and CP carries the useful information into bank lending.
This is not proof of mediation in the strict causal-inference sense. It is, however, a coherent and testable financing sequence. The result also explains why looking only at current GDP or only at bank credit can miss the early stages of the investment boom.
What the spectral analysis adds
Lag regressions ask which past quarters help predict the present. Spectral analysis asks a different question: at which cycle lengths do the two series move together, how reliable is that relationship, and which series leads?
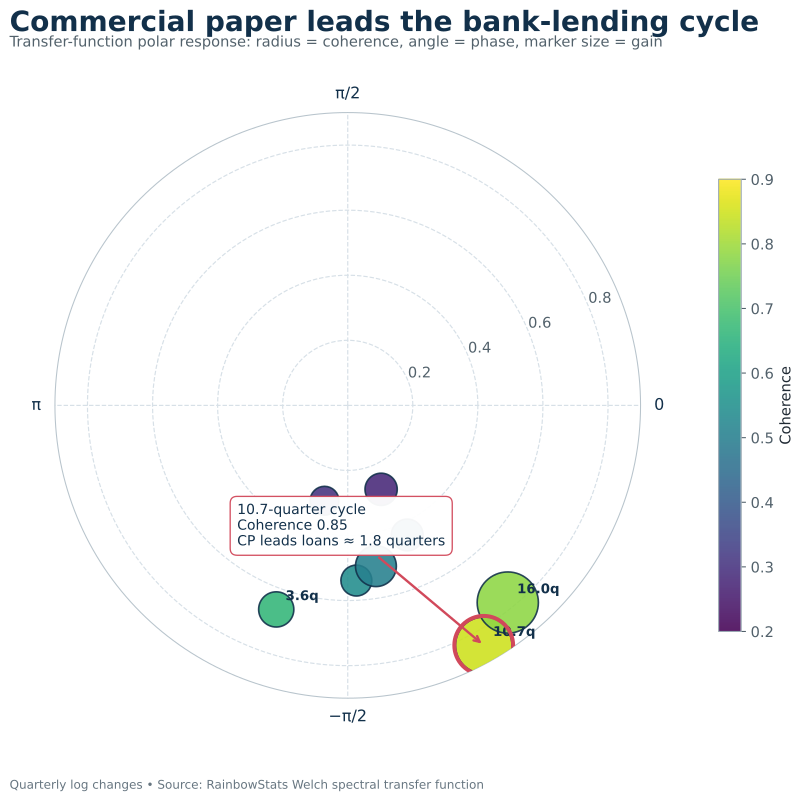
For commercial paper as the input and C&I lending as the output, the dominant relationship occurs near a 10.7-quarter cycle. Coherence is 0.85, the gain is 0.376, and commercial paper leads bank lending by about 1.8 quarters. Across the coherent frequencies, the average lead is approximately 1.5 quarters.
The economic story
The sequence is plausible. AI demand produces commitments for computing equipment, software, power and supporting infrastructure. Firms and suppliers then need flexible funding for equipment, receivables and working capital. Commercial paper can bridge that need. Bank lending follows as projects settle, inventories and receivables move through the supply chain, and balance sheets adjust.
The broader implication is that AI may already be migrating from an equity-market narrative into a measurable corporate-credit cycle. The signal is not found in a licensed stock index. It is found by combining public investment data with the timing structure of short-term corporate finance.
Reproduce the analysis
Run the complete RainbowStats script, inspect every regression and advance through the spectral transfer-function panels yourself.
Run the analysis in RainbowStatsData and methodology
Series: nonfinancial commercial paper (NFINCP), commercial and industrial lending at large domestically chartered commercial banks (CIBOARD), BEA information-processing investment (A679RC1Q027SBEA), real GDP (GDPC1) and real change in private inventories (CBIC1). Monthly series were converted to quarterly frequency; growth rates are log differences. Transfer functions use filtered residual relationships. The spectral estimates use Welch windows and retain cycles between 2 and 16 quarters.
This analysis is exploratory and macroeconomic. It does not identify the use of proceeds for individual commercial-paper issuers and does not establish firm-level causation.
The closing picture
The polar response condenses the second half of the credit chain into one image: the farther a marker sits from the center, the stronger the relationship; its angle records timing; and its size records the response. The highlighted 10.7-quarter cycle is the clearest point—high coherence, material gain and a commercial-paper lead of almost two quarters.