ECB DATA · LOAN PRICING
The Shrinking Premium on Small Euro-Area Loans
Smaller corporate loans still carry a higher interest rate than larger loans in the euro area. But that premium has narrowed substantially over the past decade. Two ECB series and a short RainbowStats script make the change visible.
The comparison covers new euro-denominated loans to non-financial corporations: loans up to €250,000 and loans over €1 million, both with floating rates or initial rate fixation of up to three months. The funding gap is the small-loan rate minus the large-loan rate, measured in percentage points.
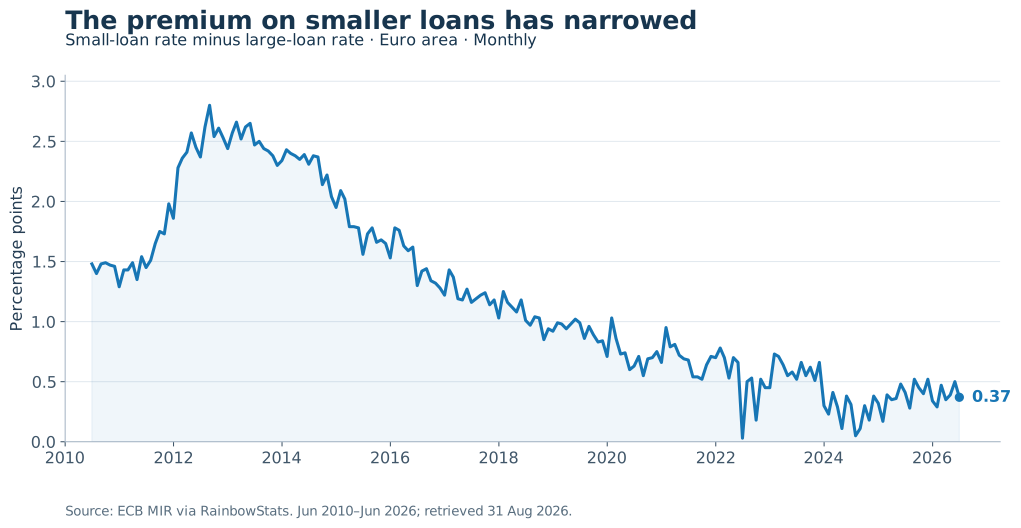
The gap reached 2.80 percentage points in August 2012. By June 2026 it was 0.37 percentage points—37 basis points—with the small-loan rate at 3.91% and the large-loan rate at 3.54%. The decline was not continuous, and June 2026 was not the historical low. The long-run reduction in the premium is nevertheless clear.
The binary split adds another view. It places the large-loan rate on the horizontal axis and the small-loan rate on the vertical axis, then fits separate relationships across time periods. A single regression would conceal how much that relationship has changed.
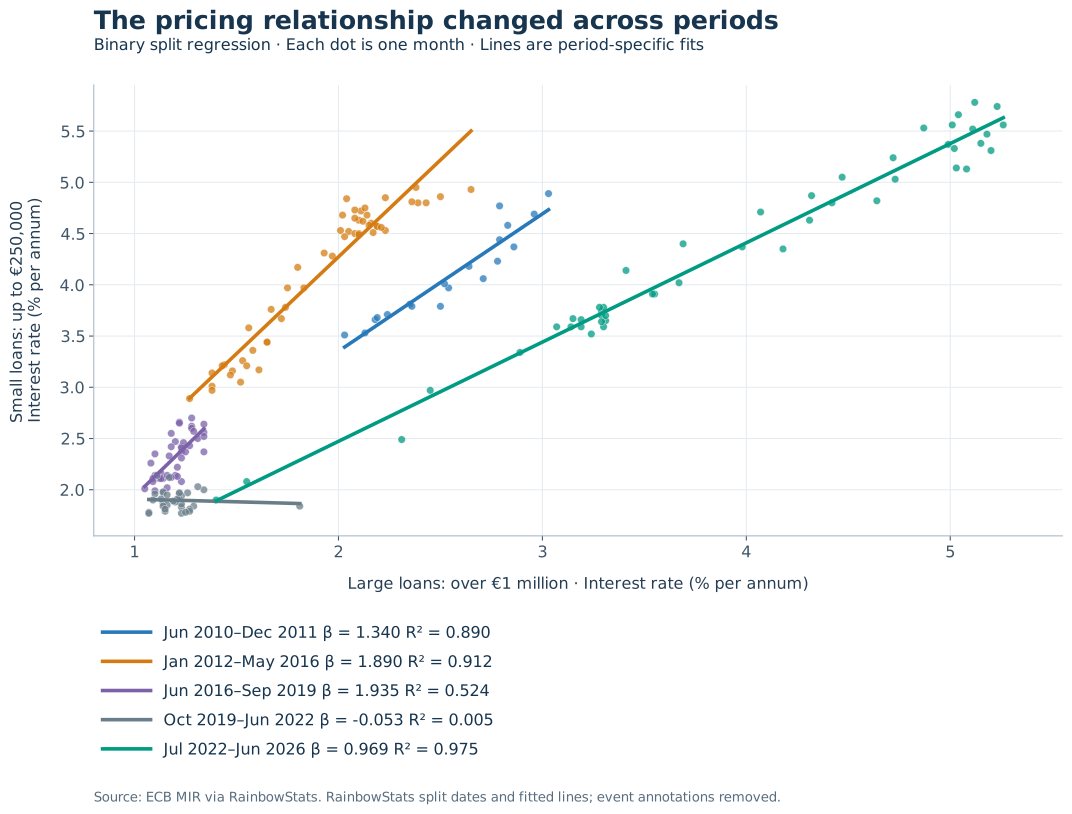
| Period | Slope β | R² |
|---|---|---|
| Jun 2010–Dec 2011 | 1.340 | 0.890 |
| Jan 2012–May 2016 | 1.890 | 0.912 |
| Jun 2016–Sep 2019 | 1.935 | 0.524 |
| Oct 2019–Jun 2022 | -0.053 | 0.005 |
| Jul 2022–Jun 2026 | 0.969 | 0.975 |
During January 2012–May 2016, the fitted slope was about 1.89. During July 2022–June 2026, it was about 0.97, with an R² of 0.975: the two rates moved almost one-for-one within that recent period. The intervening estimates show why this is not a story of a steadily falling slope. The spread chart establishes the narrowing; the split regression shows the changing relationship behind it.
This is a favorable change in the relative pricing of smaller loans. It does not establish that borrowing is cheaper in absolute terms, that credit is easier to obtain, or why the gap narrowed. Loan size is not firm size, and changes in the mix of borrowers, countries, and loans can affect these aggregate rates. The selected regression periods are descriptive, not evidence of causation.
RainbowStats brings the comparison together in six lines: retrieve the series, calculate the gap, plot it, and examine the changing pricing relationship.
Open the analysis in RainbowStats →
vixcls
smallLoans=ECB(MIR.M.U2.B.A2A.D.R.2.2240.EUR.N)
largeLoans=ECB(MIR.M.U2.B.A2A.D.R.1.2240.EUR.N)
gap=set_Name(smallLoans-largeLoans,"Funding Gap Between Large and Small Euro-Zone Loans")
line_chart(gap)
remove_annotations(binary_split(smallLoans,largeLoans))
The initial vixcls line is retained exactly as supplied; VIX is not used in either chart. The sample contains 193 monthly observations. The ECB euro-area aggregate has changing country composition. Source: ECB MIR; calculations and split regression: RainbowStats. Retrieved August 31, 2026.