Inflation Has Weights
The CPI and PPI are not simple averages. Their official weights show which price movements can actually move the headline—and why the two indexes tell different economic stories.
Inflation commentary usually begins with the latest percentage change. That skips an essential question: what is inside the index? A price index is a weighted portfolio. A component can post a dramatic price move and still have little effect on the headline if its weight is small. A modest move in a very large component can matter far more.
RainbowStats now reads the official Bureau of Labor Statistics weight tables and turns them into charts. The complete comparison requires only one line:
slideshow(weight_chart(PPIACO,0.9),weight_chart(CPIAUCSL,0.9))The second argument is a proportion limit. At 0.9, RainbowStats displays components until their cumulative official weight reaches at least 90 percent. The remaining components are combined into an Other bar, so the chart remains readable without discarding any weight.
PPI: inflation across the production pipeline
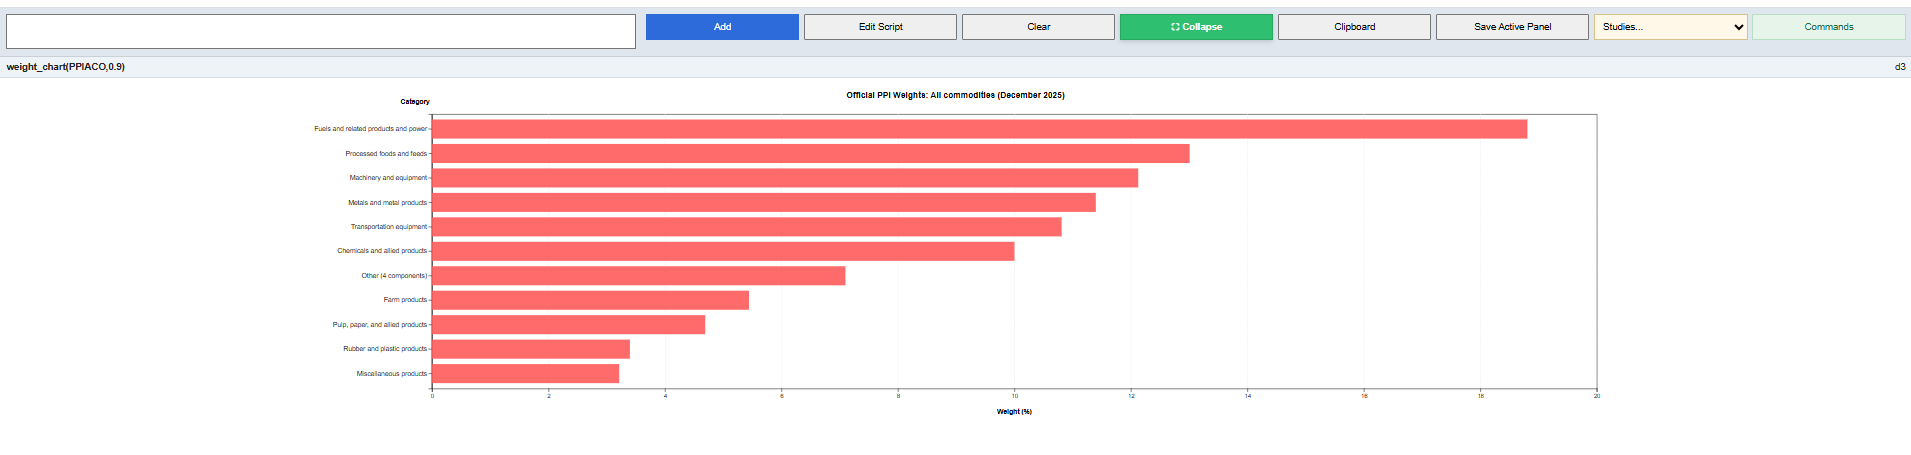
The Producer Price Index measures changes in selling prices received by domestic producers. In the All Commodities structure, fuels and related products carry the largest weight, followed by processed foods and feeds, machinery and equipment, metals, transportation equipment, and chemicals.
The striking feature is not simply which category ranks first. It is the breadth of the distribution. No single group dominates the PPI chart. Producer inflation can therefore emerge through several channels: energy, food processing, industrial materials, equipment, transportation, or chemicals. The PPI often gives us a view of cost pressure moving through the production system before the final consumer sees it.
CPI: the household budget dominates
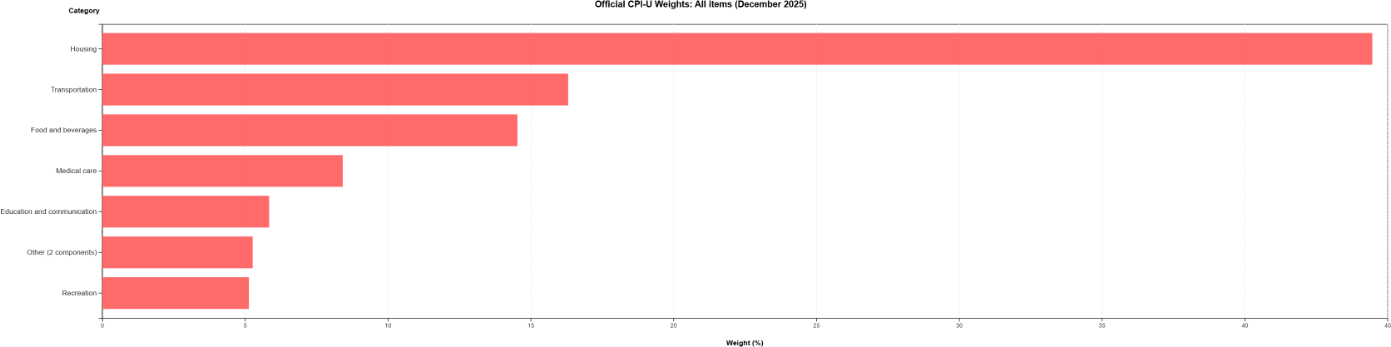
The Consumer Price Index tells a different story because its weights reflect consumer expenditures. Housing accounts for roughly 44 percent of the major-category chart—larger than transportation and food and beverages combined. Transportation, food and beverages, and medical care follow, while education and communication and recreation carry smaller shares.
This concentration explains why inflation can feel persistent even after highly visible commodity prices retreat. Falling gasoline or goods prices may help, but housing inflation can keep the broad CPI elevated because housing has so much more weight. Conversely, a sharp increase in a narrowly weighted category can generate headlines without materially changing the overall index.
Weights turn a price move into an inflation contribution
A useful first approximation is simple: a component’s contribution is its price change multiplied by its weight. The full BLS calculation is more precise, but this mental model immediately improves interpretation. Before deciding that an oil move, rent increase, food shock, or machinery surge will dominate inflation, look at the component’s official importance in the relevant index.
The PPI and CPI should therefore be read together, but not treated as substitutes. PPI shows price pressure received by producers across the production system. CPI shows price change within the household consumption basket. Their different weights are not a technical footnote; they are the reason the indexes respond differently to the same economy.
With the official weights visible, the inflation question becomes sharper: Which prices are moving, how large are their weights, and where in the economic chain is the pressure occurring?
Official methodology and weight tables: U.S. Bureau of Labor Statistics, PPI components and weights; PPI calculation concepts; and CPI relative importance.