RainbowStats · October 27, 2026
Guns, Germs, and Steel:
How Good Data Becomes Bad Analysis
Open the interactive charts and replication slideshow →
I started with a command to calculate sunlight and ended up thinking about poverty, history and how easily a true statistic can become a false accusation.
The experiment began innocently. RainbowStats now has two new functions: GEO_LOCATION defines a location using latitude and longitude, with optional elevation and time zone. SOLAR uses that location and the observation dates of an existing series to calculate daylight, sunrise, sunset, solar noon, declination, maximum solar elevation and extraterrestrial radiation. The input series supplies the calendar; its measured values do not drive the solar calculation.
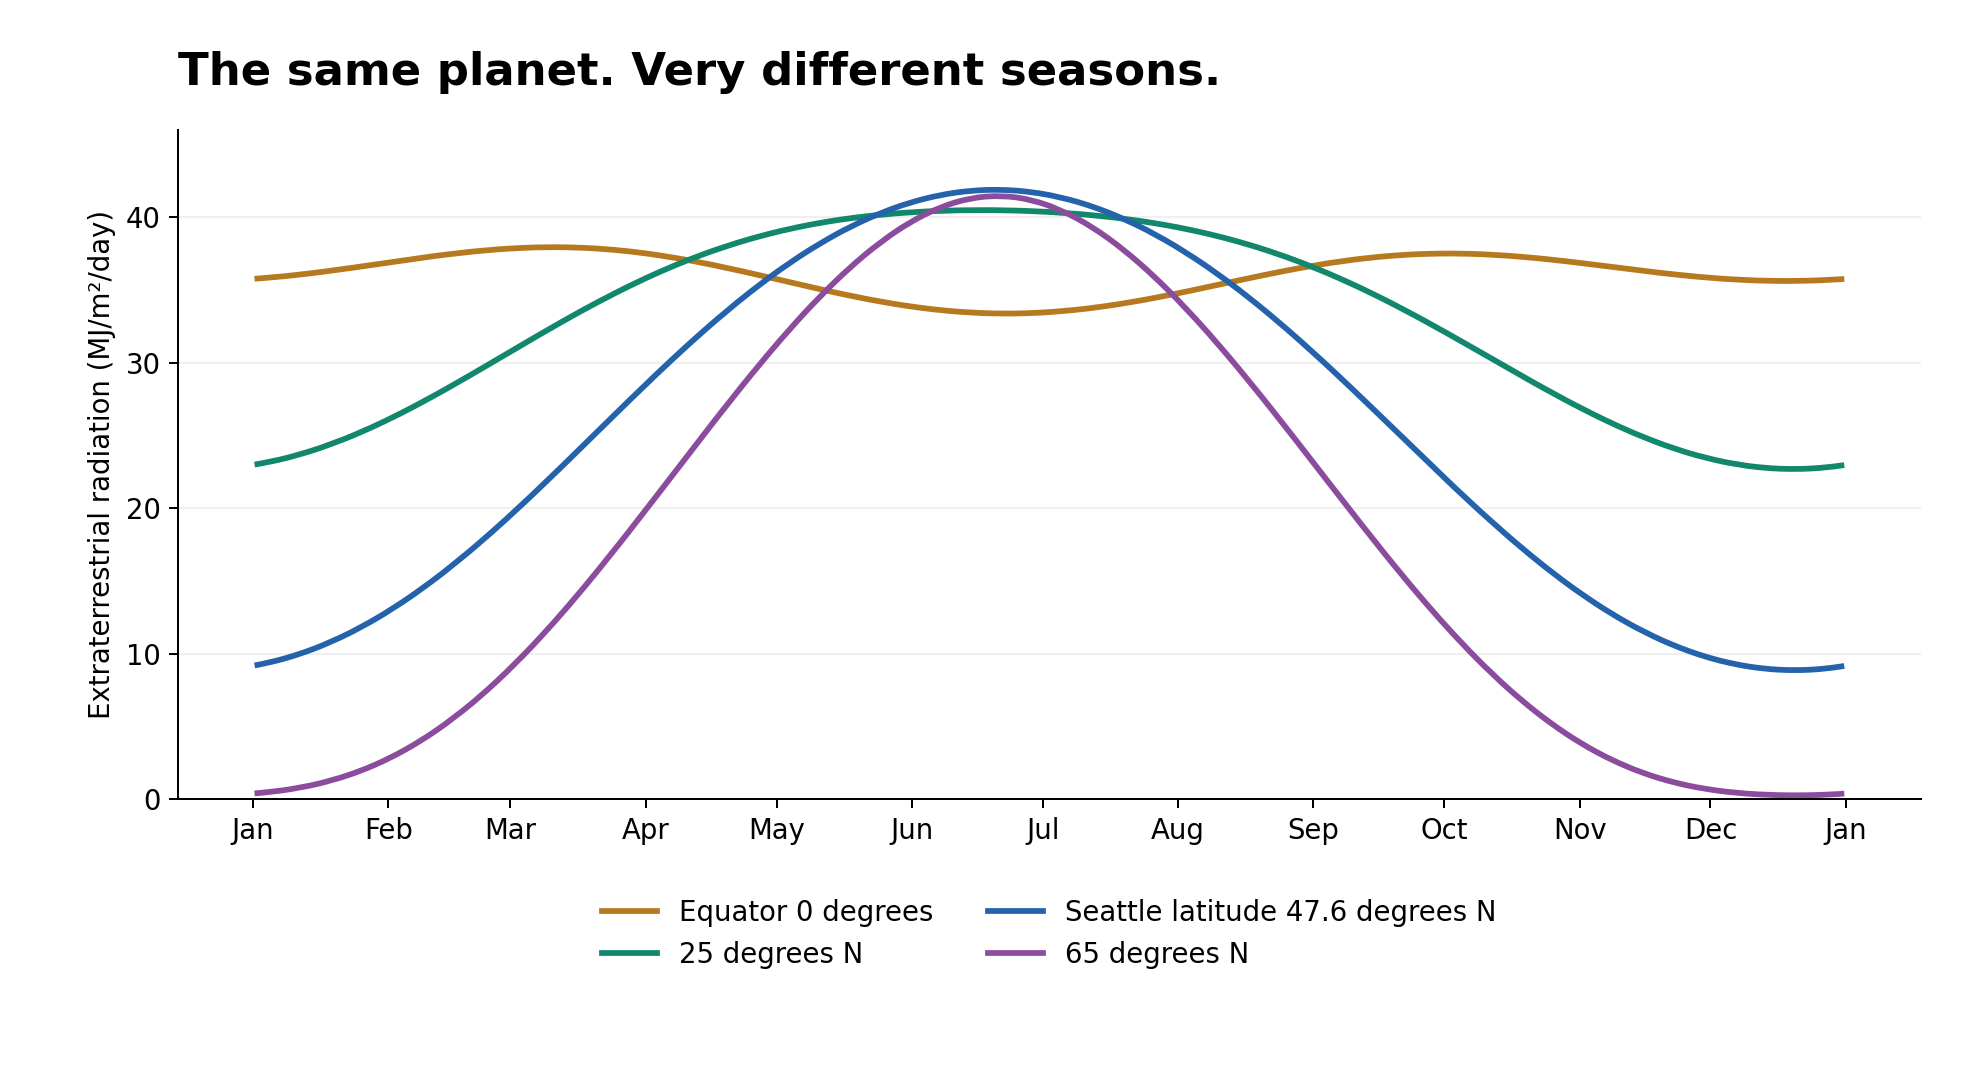
The first chart shows the seasonal pattern. Seattle can receive more daily solar energy above the atmosphere than the equator in June because its summer days are longer. Winter is where we pay for it. These are astronomical calculations, not measurements of sunlight reaching the ground. Clouds, aerosols and local shading are outside this calculation.
Then I asked: could we compare solar radiation with poverty?
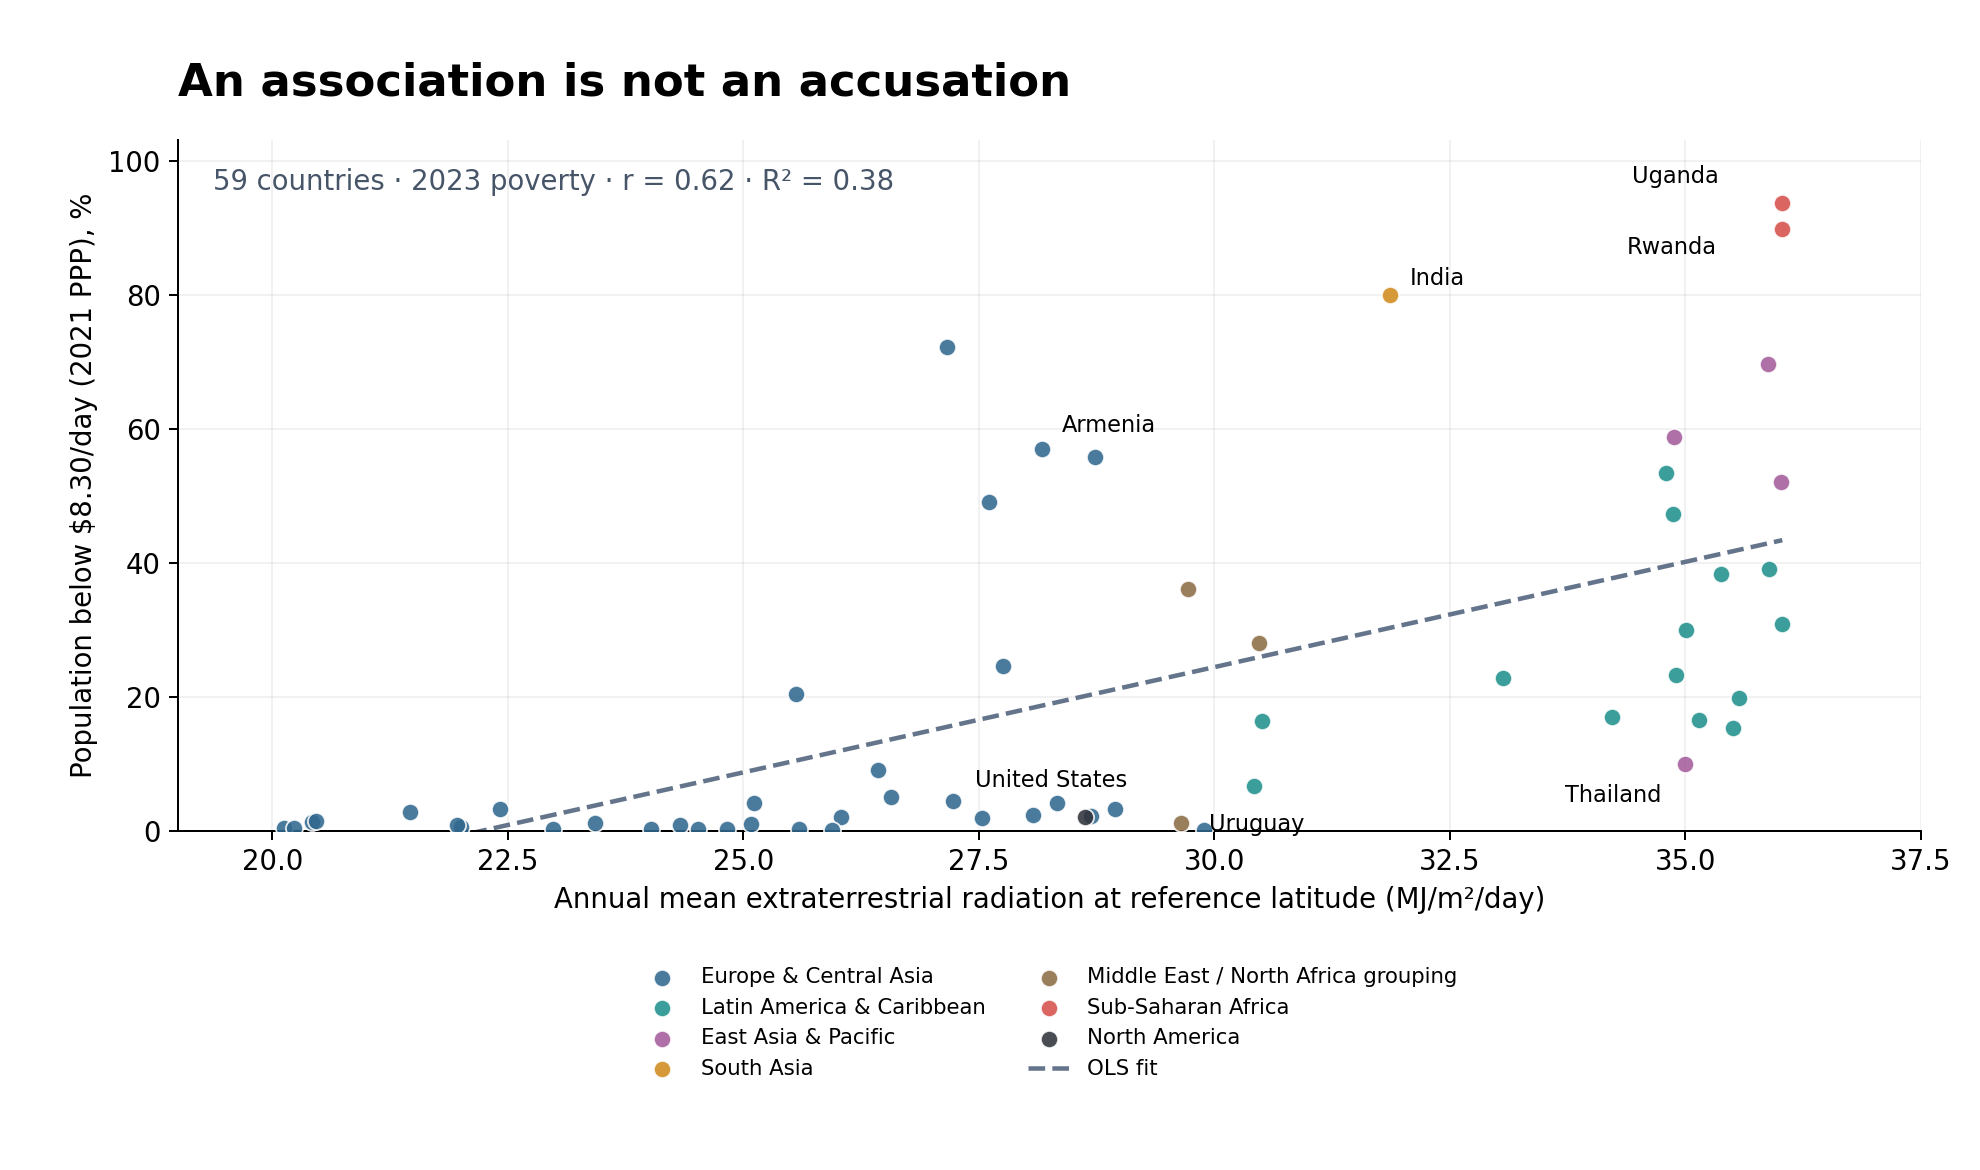
Across 59 countries with usable 2023 poverty observations and reference coordinates, higher calculated solar radiation is associated with higher poverty. The correlation is about 0.62; the simple linear fit has an R-squared of about 0.38. Poverty here means the share living below $8.30 per person per day in 2021 purchasing-power terms. It is one common threshold, not each country's national poverty definition.
Jared Diamond’s Guns, Germs, and Steel came to mind. His account examines geography, food production, domesticable plants and animals, disease and the spread of technology. Our scatter plot does not test that account. A familiar explanation is still only a hypothesis.
Our solar variable is largely a transformation of latitude. We have not separated geography from institutions, colonial history, education, disease, conflict or industrial development. We use one reference latitude per country, not a population-weighted national measure. The sample includes many European countries but only two African countries. A common year avoids mixing dates; it does not create a representative sample.
Now imagine someone presents this chart as proof that people in sunny countries are lazy, or as proof that one government, population or ideology caused their poverty. The plotted numbers can be accurate while the accusation remains unsupported. We measured neither work effort nor responsibility. The same chart cannot tell us whether a particular historical explanation is right, either.
That is how a half-truth works: keep the accurate statistic, omit what it cannot establish, and let the audience supply the accusation. Sometimes this is deliberate; sometimes we simply believe the first story that fits. The temptation applies to my own preferred explanations as much as anyone else's.
A useful chart should start a question. It should not end a trial.
Appendix: methods, coverage and sources
The seasonal chart reproduces the RainbowStats output at its 2025 observation dates. Treasury yields supply those dates only; their values are irrelevant. The poverty scatter reproduces the same 59 pairs as the script, with regional colors added for readability. Each country has equal weight.
Solar means use the FAO-56 formula implemented in SolarOperator, calculated independently for every day of 2023 and averaged over all 365 days. They are not national spatial averages, population-weighted exposure estimates or measures of solar-panel output. World Bank reference coordinates are used as supplied; their precision does not make them representative of a whole country.
Only countries with both usable reference coordinates and a 2023 poverty observation enter the scatter. Canada and Mexico have no 2023 observation in this extract; Rwanda and Uganda are its only African countries. This is a limited available-data sample, not a representative survey of the world. The $8.30 line is a common purchasing-power benchmark, not every country’s national poverty line.
The OLS correlation is 0.6156 and R² is 0.3789. Neither is a causal estimate. The plot omits the script’s dispersion bands and limits the poverty axis to nonnegative values; a linear fit can otherwise produce impossible negative rates. In the script, synthetic monthly row dates match countries between arrays and have no economic interpretation.
Download all 59 country observations (CSV) · Download the RainbowStats script
- World Bank: poverty headcount below $8.30/day, 2021 PPP (SI.POV.UMIC).
- World Bank country reference coordinates and regions.
- PBS companion to Jared Diamond’s Guns, Germs, and Steel.
World Bank data retrieved October 27, 2026; World Development Indicators, CC BY 4.0. This post critiques our inference, not Diamond’s integrity or the reliability of the World Bank.