RainbowStats Research | October 2026
Can artificial intelligence discover profitable trades that fifty years of market competition have somehow overlooked?
I have asked traders a version of that question for years. If a trading system reliably discovers profitable opportunities, why would those opportunities remain available? And if AI makes such discoveries easier for everyone, why would the resulting profits not disappear even faster?
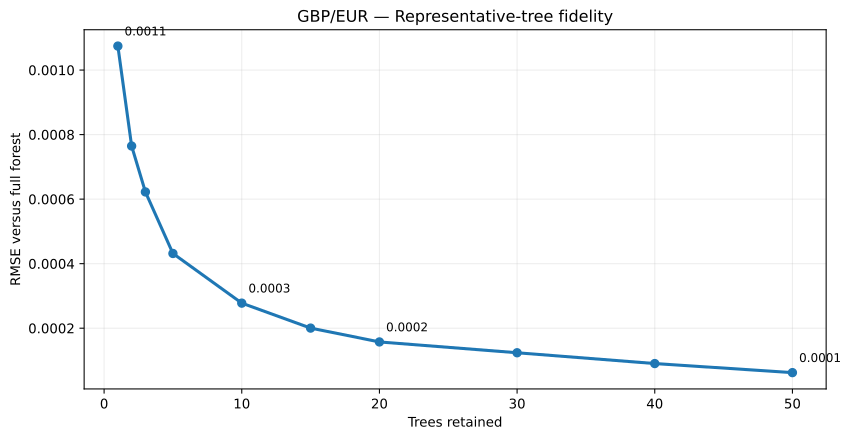
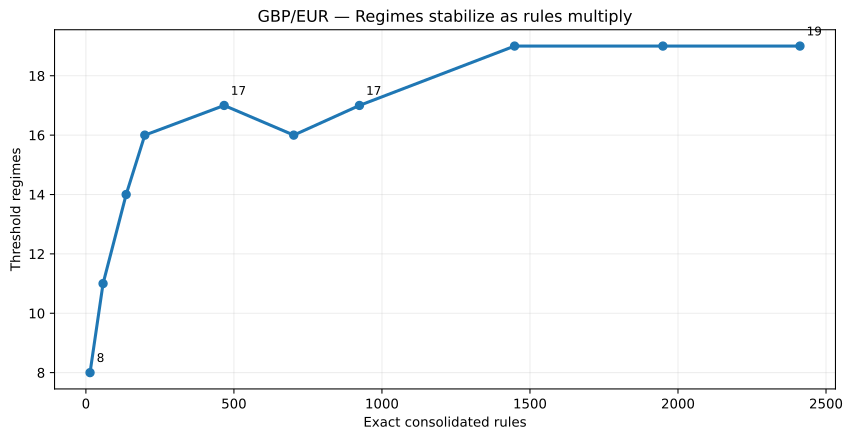
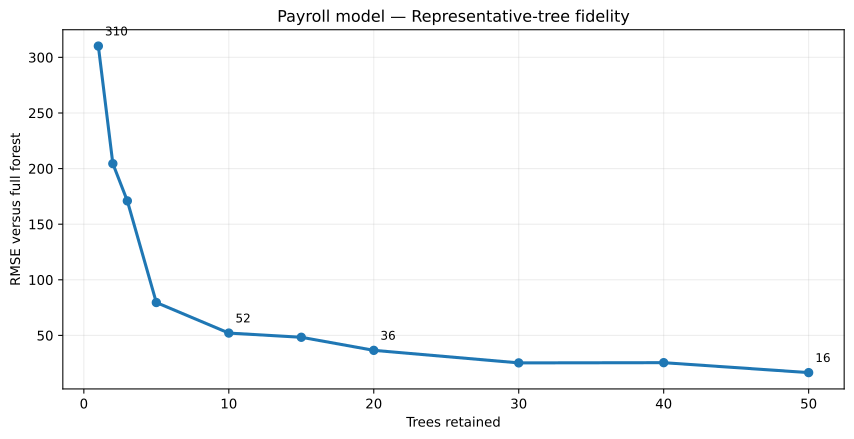
Our investigation began with a much smaller question: Can we prune a random forest without losing much of its explanatory power? We built a method to select representative trees, consolidate terminal rules, and identify recurring threshold regimes. The resulting compression charts are fascinating. A relatively small subset of trees can closely reproduce a much larger ensemble, while the number of broad regimes often stabilizes long before the number of detailed rules does.
But that achievement raised a more important question. Does reproducing a sophisticated model mean that the model knows anything useful about tomorrow?
Random forests can generate hundreds of trees and thousands of terminal regions. This complexity makes them powerful, but it also makes them difficult to interpret. RainbowStats now selects representative trees by measuring how faithfully they reproduce the predictions of the full forest. We can then examine consolidated rules and threshold regimes.
The compression curves tell an interesting story: adding trees improves fidelity to the original ensemble, yet the number of regimes may change little. This suggests that much of the forest's detail is repetitive. It does not mean that the remaining regimes are stable economic laws, nor that the reduced forest predicts future observations accurately. Our compression metric is measured against full-forest predictions on training observations.
| Trees | Fidelity RMSE | Exact rules | Regimes |
|---|---|---|---|
| 5 | 0.000432 | 199 | 16 |
| 10 | 0.000278 | 467 | 17 |
| 20 | 0.000157 | 924 | 17 |
| 50 | 0.000062 | 2412 | 19 |
That distinction is the bridge between machine learning and finance. An AI system can become extraordinarily good at describing historical prices without becoming good at forecasting them.
We turned to the daily pound/euro exchange rate, using ECB data beginning in 2020. RainbowStats transformed the exchange rate into daily log returns and used a genetic search to choose lagged predictors. We enforced a minimum lag to avoid the obvious error of using information from the same observation date to predict itself.
The results were sobering. On the chronological holdout, the discovered model had an RMSE of 0.002240, compared with 0.002142 for a simple historical-mean baseline. Its test R-squared was −0.094. The more elaborate model was approximately 4.6% worse on RMSE.
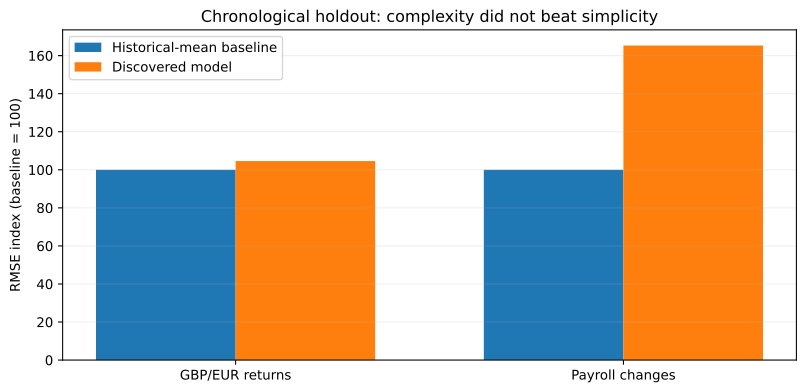
This is one model, one currency pair, and one sample period—not a proof of the efficient-market hypothesis. Nor is forecasting RMSE a trading profit-and-loss statement. But the result illustrates a basic problem for vendors selling AI-powered trading systems: a complicated historical relationship is not a demonstrated economic advantage.
We repeated the exercise with monthly changes in U.S. nonfarm payroll employment. The candidate predictors included lagged industrial production, capacity utilization, consumer prices, and unemployment.
Here the model performed even worse relative to its baseline. Its holdout RMSE was 457.90 thousand jobs, versus 277.03 thousand for the baseline, and the reported test R-squared was −2.995.
The macroeconomic comparison matters because it challenges an easy escape from the currency result: perhaps financial markets are simply too efficient, while economic data offer stable, discoverable relationships. Not necessarily. Economic series have structural breaks, revisions, release delays, and extraordinary shocks. AI does not eliminate those problems.
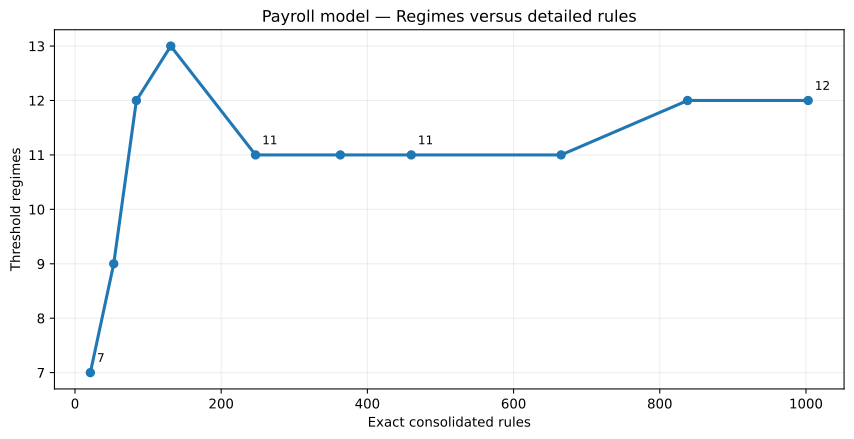
The payroll result should not be treated as a clean real-time forecasting test. We used historical revised series, not point-in-time data vintages, and observation lags are not the same as publication lags.
In 1970, Eugene Fama's Efficient Capital Markets: A Review of Theory and Empirical Work articulated a proposition that still challenges every trading system: prices reflect available information. If a widely known pattern can be converted into an easy profit, competitive traders have an incentive to exploit it, moving prices until the opportunity is reduced. [Original 1970 paper]
AI does not repeal that logic. It may strengthen it.
Suppose one model discovers a profitable exchange-rate pattern. Other systems—perhaps using neural networks, forests, or conventional regressions—may discover economically similar trades. They need not converge to the same equation. They need only buy and sell in sufficiently similar ways. Their trading brings anticipated price changes forward and competes away the return.
The more capable AI becomes at finding widely accessible inefficiencies, the more capable the market becomes at eliminating them.
This is not a claim that every market is perfectly efficient. Grossman and Stiglitz showed why perfect informational efficiency is paradoxical when gathering information is costly: investors need an incentive to discover it. Risk, transaction costs, capital constraints, private information, and new economic shocks can preserve opportunities. But those are reasons to demand more rigorous evidence of an advantage, not less. [1980 study]
I have put that question to traders privately for years. It is now a question worth asking publicly of the expanding industry selling AI trading strategies.
A model can fit history. It can identify regimes. It can be compressed into an elegant set of rules. It can even produce a statistically useful forecast. None of those accomplishments establishes a profitable trading strategy after spreads, fees, financing, slippage, risk, and competition.
To establish that, we need a genuinely untouched holdout, predictions based only on information available at the time, a transparent trading rule, realistic costs, and evidence that the result survives changing market conditions. We have not completed that trading backtest here.
Our RainbowStats experiments therefore support a narrower, but important, conclusion: greater model complexity and better in-sample compression fidelity did not establish better out-of-sample forecasts. In the currency experiment, the AI model failed to beat a simple baseline.
The old efficient-market hypothesis has survived another encounter with a fashionable technology—not because our small experiment proves it, but because the economic argument remains formidable. If AI really can find an easy, reproducible profit, competition gives us a compelling reason to ask how long that profit can last. [Fama’s 1991 reassessment]
And if thousands of subscribers can buy the same signal, I keep coming back to the same question:
Why bother?
The main article deliberately focuses on the argument. The full RainbowStats presentation contains the charts, model-selection tables, forest-compression curves, consolidated regimes, regression diagnostics, and macroeconomic comparison.
Open the complete interactive RainbowStats analysis
| Trees | GBP/EUR rules | GBP/EUR regimes | Payroll rules | Payroll regimes |
|---|---|---|---|---|
| 1 | 14 | 8 | 21 | 7 |
| 2 | 58 | 11 | 53 | 9 |
| 3 | 136 | 14 | 84 | 12 |
| 5 | 199 | 16 | 131 | 13 |
| 10 | 467 | 17 | 247 | 11 |
| 15 | 702 | 16 | 363 | 11 |
| 20 | 924 | 17 | 460 | 11 |
| 30 | 1448 | 19 | 665 | 11 |
| 40 | 1949 | 19 | 838 | 12 |
| 50 | 2412 | 19 | 1003 | 12 |
The compression charts plot the fidelity error between representative-tree predictions and the original full forest, alongside the number of consolidated terminal regions and threshold regimes. These are training-sample model-compression diagnostics, not trading performance or holdout accuracy. The apparent stability of regime counts is descriptive, not proof of a stable market mechanism.
The presentation includes the exchange-rate level, daily log returns, genetically selected lagged predictors, the chronological holdout comparison, and the representative-forest compression chart. The model's RMSE was 0.002240 versus 0.002142 for the baseline; test R-squared was −0.094. Log-return units are dimensionless.
The monthly payroll experiment uses changes in PAYEMS with lagged changes in INDPRO, TCU, CPIAUCSL, and UNRATE. Its reported holdout RMSE was 457.90 thousand jobs versus 277.03 thousand for the baseline. Revisions, data availability, and economic regime shifts remain important qualifications.
A complete evaluation of AI trading claims requires an explicitly specified position-sizing and execution rule; no-lookahead, point-in-time inputs; realistic bid-ask spreads and financing costs; and a genuinely untouched out-of-sample profit-and-loss comparison. Reduced forests should also be evaluated directly on the same holdout, rather than solely by their fidelity to the full forest.