RainbowStats™ · Economic Analysis
Basic Economic Theory Still Holds
A negative ex post sacrifice ratio does not mean demand pressure became disinflationary.
A chart on X caught my attention. I later found its source: Mike Konczal's January 2025 essay, Did We Tame Inflation With No Economic Cost? The Sacrifice Ratio Has the Wrong Sign. The chart plotted year-over-year core PCE inflation against real GDP growth relative to the Congressional Budget Office's estimate of potential growth. The pandemic observations were connected into a vivid blue path. Inflation came down as growth remained strong.
Konczal calculates a modified sacrifice ratio of −0.04: inflation declined without an associated cumulative loss of output. He interprets the episode as evidence that the cost-push term in the Phillips curve was doing most of the work. That broad supply-side explanation is plausible, and our results support it. Supply pressure rose with inflation and its subsequent normalization helped inflation fall without a recession.
Where we differ is the meaning of the “wrong sign.” A favorable supply shift can generate a negative observed sacrifice ratio without reversing the underlying relationship between demand pressure and inflation. The sequence is real. The implication that stronger demand became disinflationary is not.
A line connecting observations through time can tell a compelling story, but it is not a model. Both variables are moving through an unusual episode, and the starting date, the exclusion of 2020 and the decision to connect the pandemic observations all influence what the eye sees. The proper question is not whether inflation was lower at the end of the path. It is whether stronger growth is associated with inflation accelerating or decelerating after supply pressure is taken into account.
First, lengthen the history
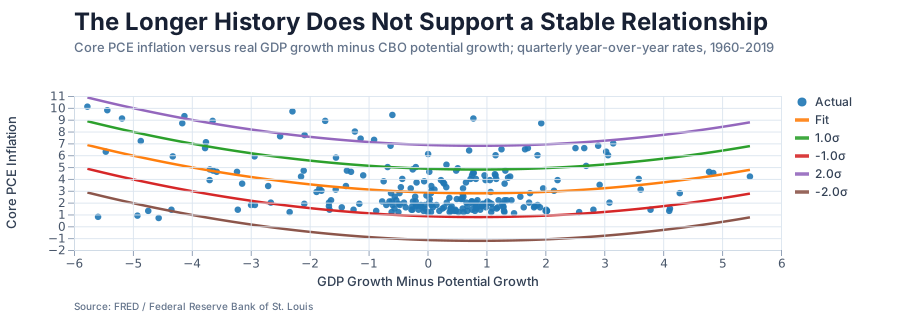
The original comparison begins in 1991. We extended the data to 1960, using quarterly year-over-year core PCE inflation and real GDP growth minus the year-over-year growth of CBO potential GDP. The negative relationship is weak over the full history and disappears in the period emphasized by the original chart.
| Sample | Slope | t-statistic | R² |
|---|---|---|---|
| 1960–2019 | −0.264 | −3.92 | 0.061 |
| 1960–1989 | −0.356 | −4.33 | 0.137 |
| 1991–2019 | −0.014 | −0.37 | 0.001 |
| 2021–2024 | −0.016 | −0.15 | 0.002 |
The full-sample negative slope is largely an artifact of the earlier inflation regime. From 1991 through 2019—the red cloud in the original picture—the growth gap explains essentially none of the variation in core inflation. Nor does a simple regression through the pandemic path. The visual impression comes from chronology, not from a stable relationship between the two variables.
Ask the economically relevant question
The level of inflation is not the same as the change in inflation. A country can have inflation that remains high but is falling, just as a car can still be traveling fast while slowing down. If the claim is that faster growth brought inflation down, the dependent variable should measure inflation's acceleration or deceleration.
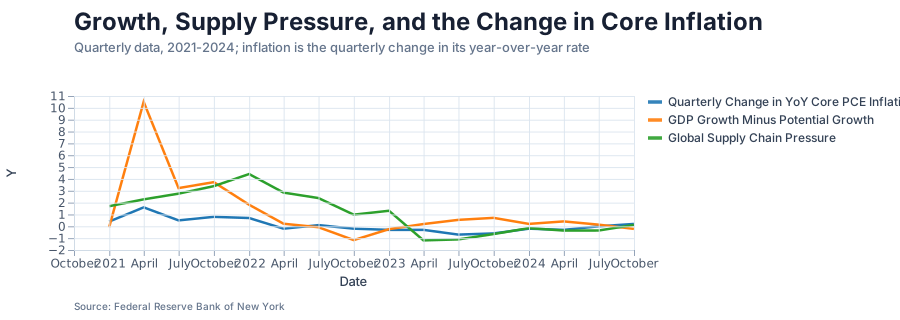
We therefore changed the dependent variable to the quarterly change in year-over-year core PCE inflation. We then controlled for the contemporaneous GDP growth gap, the quarterly change in WTI crude oil prices and the New York Fed's Global Supply Chain Pressure Index.
For 2021–2024, the estimated equation is:
| Variable | Coefficient | Standard error | t-statistic |
|---|---|---|---|
| Constant | −0.256 | 0.083 | −3.07 |
| GDP growth minus potential growth | +0.149 | 0.029 | 5.06 |
| Quarterly WTI log change | −0.006 | 0.006 | −1.07 |
| Global Supply Chain Pressure Index | +0.161 | 0.045 | 3.57 |
The adjusted R² is 0.773. A GLS robustness check produces the same central result: the growth-gap coefficient rises to +0.179 with a t-statistic of 4.97.
Inflation fell despite faster growth, not because of it.
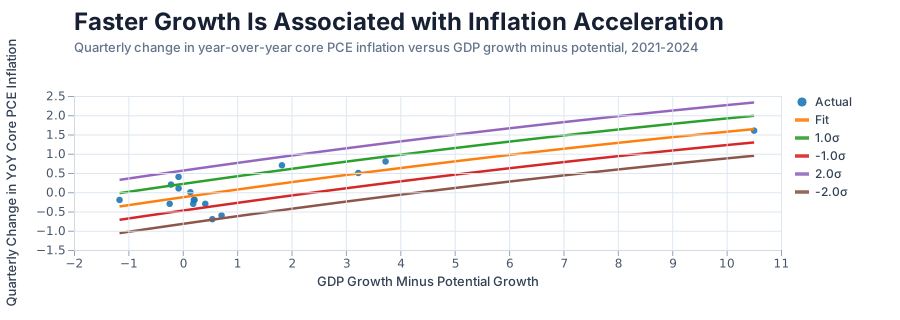
Holding measured supply pressure constant, an additional percentage point of growth relative to potential is associated with roughly 0.15 to 0.18 percentage point more quarterly acceleration in year-over-year core inflation. That is the positive sign basic economic theory predicts.
The positive GSCPI coefficient tells the other half of the story. Greater supply-chain pressure is associated with accelerating inflation. As those pressures receded, inflation could fall without requiring the economy to contract. The negative constant captures additional underlying disinflation after the included growth and supply variables are held fixed.
The WTI coefficient should not be overinterpreted. It is statistically insignificant in the ordinary regression, the sample contains only 16 quarterly observations, and core PCE deliberately excludes the direct prices of food and energy. The exercise is a diagnostic, not a claim to have identified a complete structural model of inflation.
The pre-pandemic dynamics agree
We also estimated a distributed-lag model from 1998 through 2019. The contemporaneous growth-gap coefficient is +0.070 with a t-statistic of 2.51. A negative coefficient appears at the two-quarter lag, while the other lags are small. Summed across five quarters, the growth-gap coefficients are approximately +0.03—not negative. Oil shocks are inflationary, and the model's Durbin–Watson statistic is 2.02.
This longer exercise is less dramatic than the connected blue line. It is also more informative. Growth pressure does not reliably reduce inflation. Its cumulative effect is modestly positive, with timing that varies across quarters.
A negative sacrifice ratio does not overturn basic theory
There are two familiar ways for output to grow. Stronger demand can push production above potential, increasing inflation pressure. Improved supply can expand production capacity while lowering costs and inflation. Pandemic-era disinflation combined elements of both: supply chains healed while demand and employment remained strong.
That combination is not a refutation of economics. It is the textbook implication of an outward shift in aggregate supply. The economy was able to produce more with less upward price pressure. Continued demand strength prevented a recession, but it worked against the speed of disinflation rather than causing it. The realized sacrifice ratio can therefore be negative even while the partial effect of demand pressure on inflation remains positive.
The conclusion
Konczal is right that the supply shock matters. The remarkable outcome was not that growth cured inflation; it was that supply normalization allowed inflation to decline without the usual sacrifice of lost output and employment. The observed sacrifice ratio had an unusual sign, but the underlying demand coefficient did not. Basic economic theory still holds.
Data and replication
The analysis uses FRED series BPCCRO1Q156NBEA for quarterly year-over-year core PCE inflation, A191RO1Q156NBEA for year-over-year real GDP growth, GDPPOT for CBO real potential GDP and WTISPLC for WTI crude oil prices. Global supply pressure is from the Federal Reserve Bank of New York's GSCPI. All transformations, samples and regression output are available in the linked RainbowStats slideshow. Data are revised over time, so exact results may change modestly when the analysis is rerun.