The President often uses provocative social-media posts to command attention and energize supporters. Two recent examples reduce a relationship between sovereign democracies to territorial spectacle: an apparent AI hockey animation showing Donald Trump standing over Canadian Prime Minister Mark Carney, and a map placing Canada, Mexico, Greenland, Iceland and much of the region beneath the American flag.

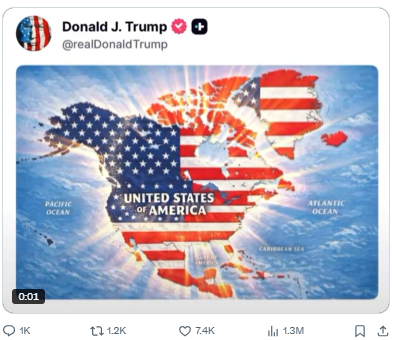
The images can be dismissed as jokes. That response misses their political function. Propaganda need not be solemn, coherent or even believable. It can work through repetition, humiliation and play—turning another country’s sovereignty into a punch line and making an extraordinary proposition feel less extraordinary the next time it appears.
Hayek’s warning was about complacency
The Road to Serfdom was published in 1944, after Europe had learned that achievement in philosophy, music, science and literature offered no automatic protection against political catastrophe. Hayek’s particular argument concerned centralized power and the erosion of individual freedom. One need not accept every link in his economic argument to retain the institutional warning: free societies can lose their bearings gradually, while each departure from restraint is explained as temporary, necessary or unserious.
Our previous essay considered Kenneth Keniston’s alienated youth and the search for identity, belonging and purpose. It is tempting to connect that framework to the audience for today’s confrontational politics. But the present data cannot demonstrate that the President’s political base consists of Keniston’s alienated young people. At most, the comparison gives us a question worth asking: why can messages built around grievance, dominance and humiliation feel emotionally satisfying to some citizens?
The democratic concern is normalization. A single theatrical post does not prove an authoritarian endpoint. Repeated “jests,” however, may habituate an audience to language that would once have been rejected as incompatible with relations among sovereign allies. A slippery slope is not an inevitability; it is a reason to notice the direction of travel.
Canada’s answer is not merely rhetorical
Canada is led by someone unusually familiar with financial markets and institutional stress. Mark Carney earned an economics degree at Harvard and an M.Phil. and D.Phil. in economics at Oxford. He governed both the Bank of Canada and the Bank of England and chaired the Financial Stability Board. Credentials do not guarantee good policy, but Carney is no intellectual lightweight and is unlikely to mistake a social-media threat for an economic strategy.
The data are more interesting than the insults. They do not show a costless escape for Canada: the United States remains its dominant trading partner, and a severe rupture would hurt Canadian firms and households. They do show that Canada is not financially panicked, lacks no alternatives, and possesses strategic assets on which important parts of the American economy depend.
First, the pressure can strike American exporters
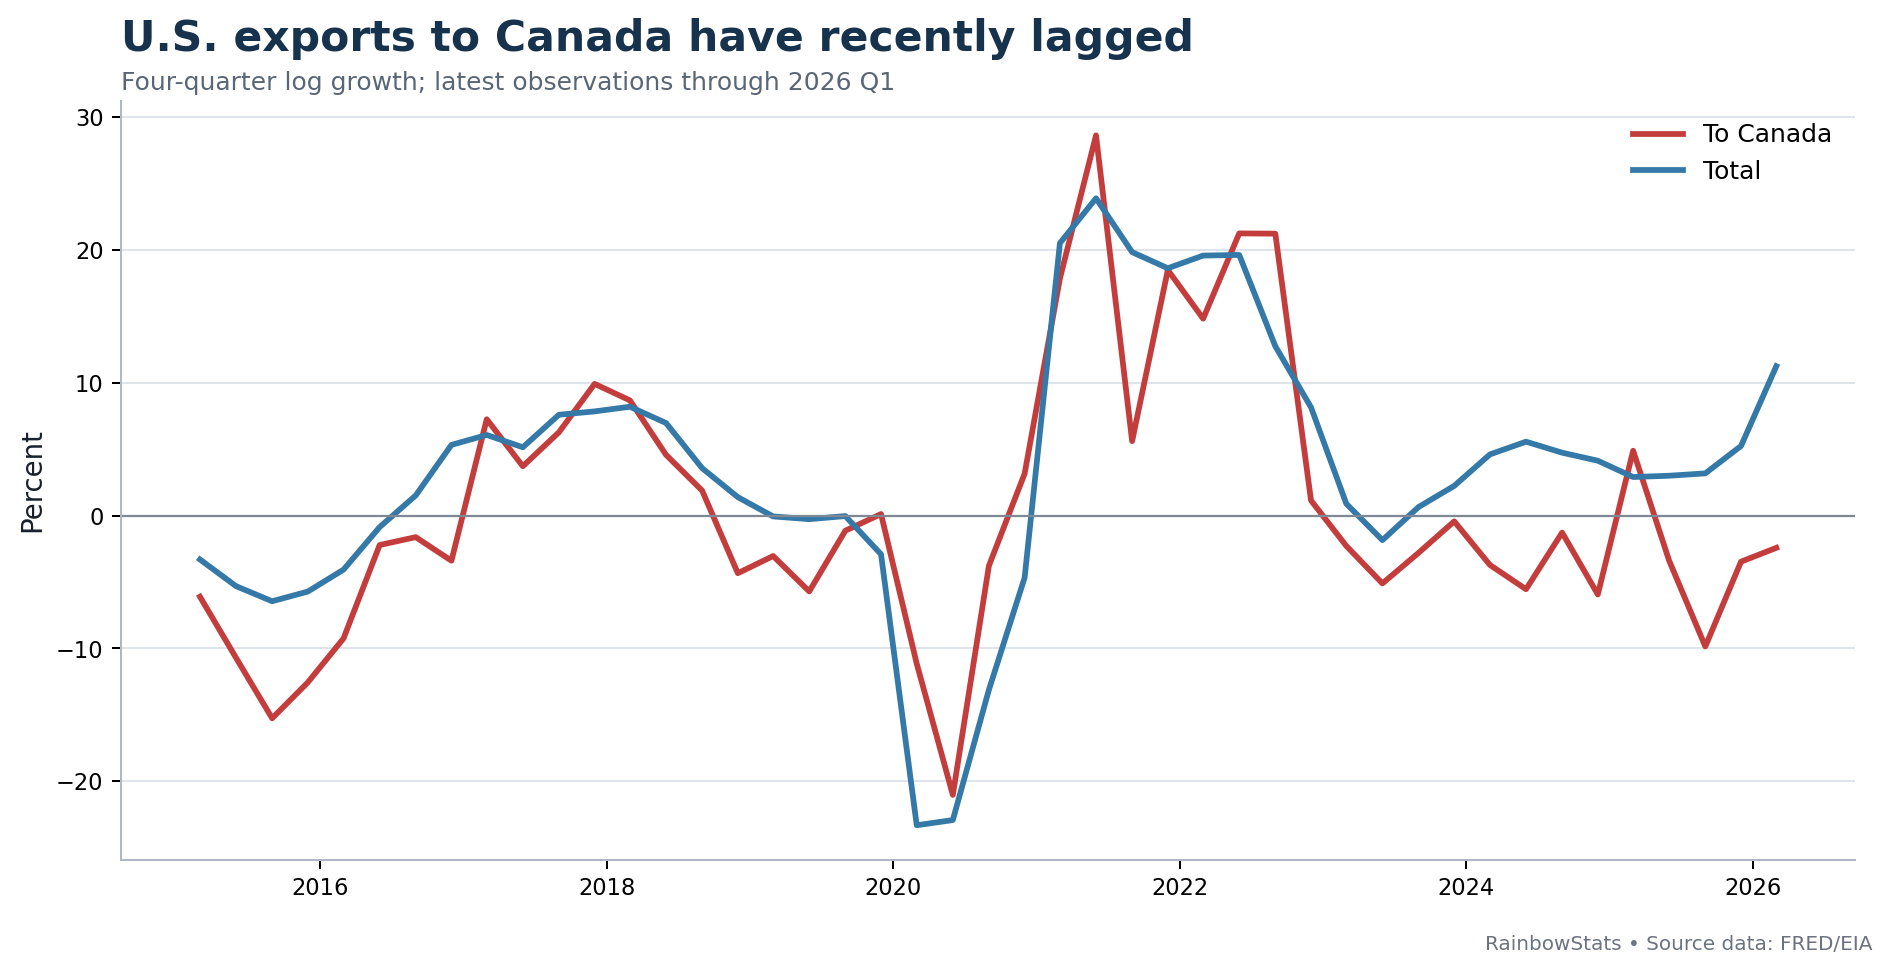
Four-quarter growth in U.S. goods exports to Canada has recently fallen below growth in total U.S. exports. In the RainbowStats regression, the post-January-2025 dummy for exports to Canada is about −7.1 percentage points, with a t-statistic near −2.18. That is the most conspicuous statistical break in this study.
It is not proof that tariffs alone caused the divergence. Annual overlapping growth rates create serial correlation, and a dummy variable cannot isolate every simultaneous shock. The responsible conclusion is narrower: the pattern is consistent with emerging damage to the bilateral trading relationship, and the damage appears on the American export side as well.
Second, financial markets are not signaling Canadian distress
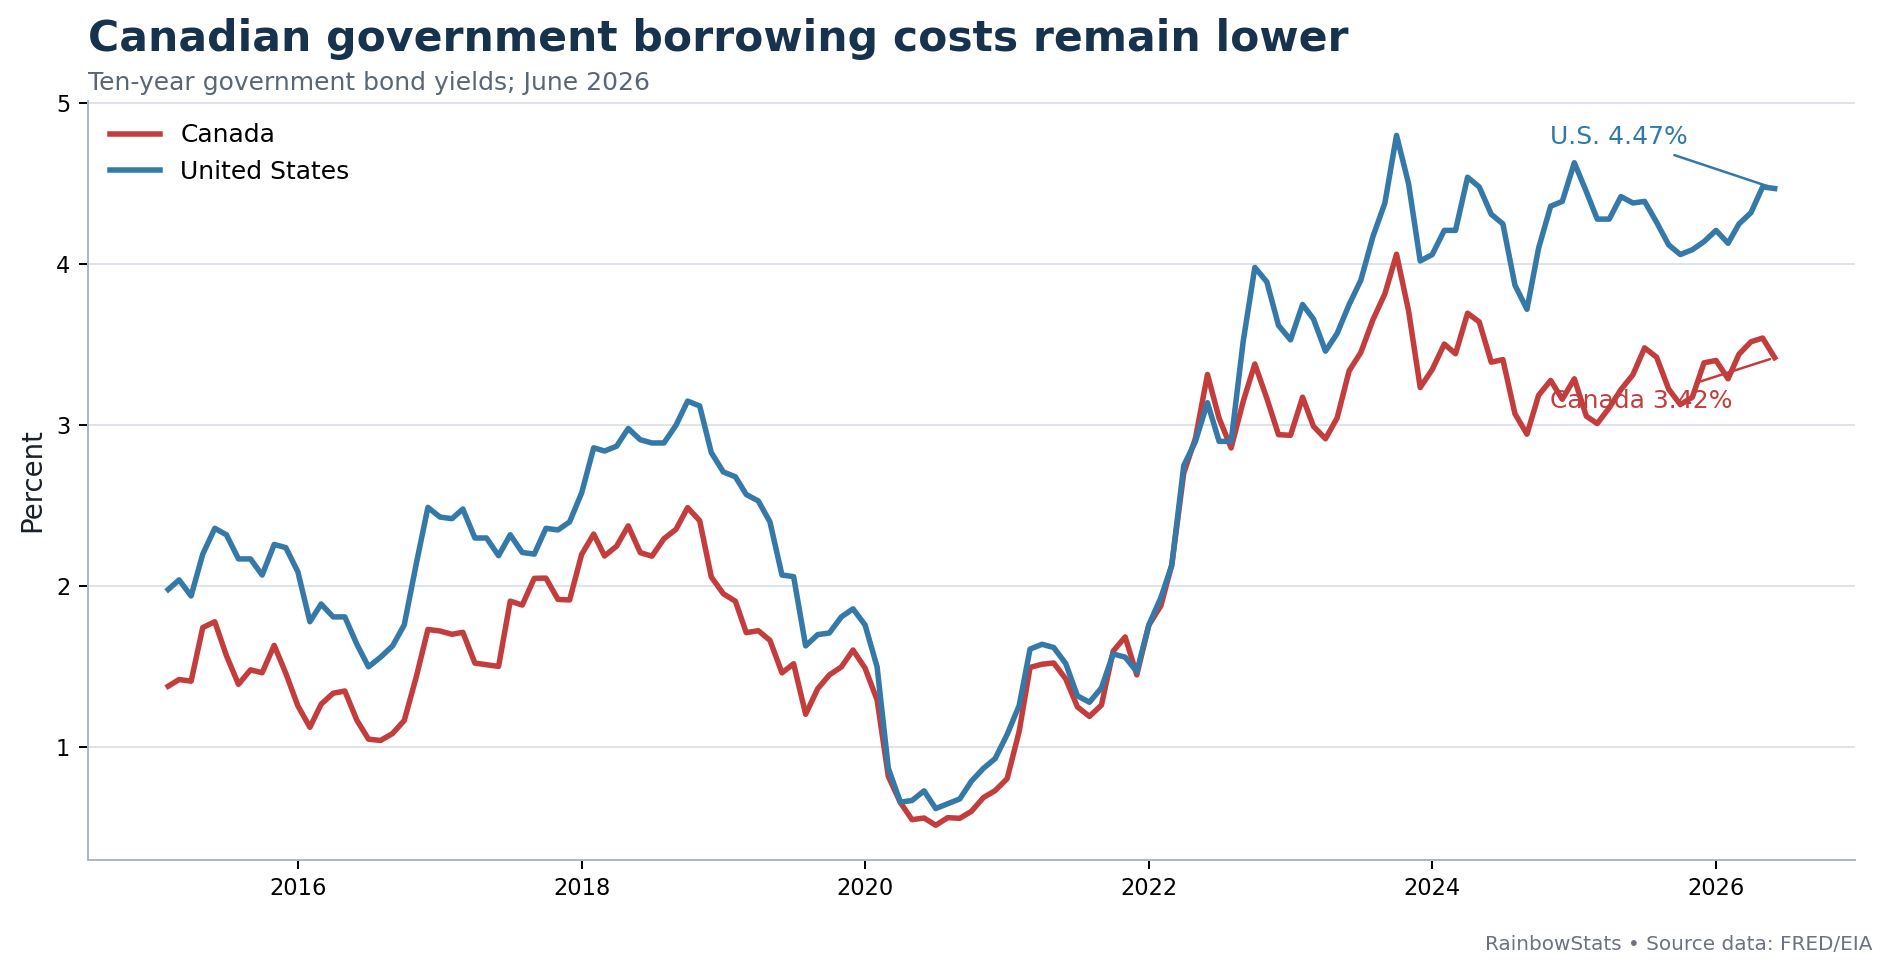
In June 2026, Canada’s 10-year government bond yield was 3.42%, compared with 4.47% for the U.S. Treasury benchmark. The 105-basis-point gap should not be oversold: different inflation outlooks, central-bank paths and economic structures all affect sovereign yields. But it is difficult to reconcile with a story in which investors regard Canada as the uniquely imperiled sovereign.
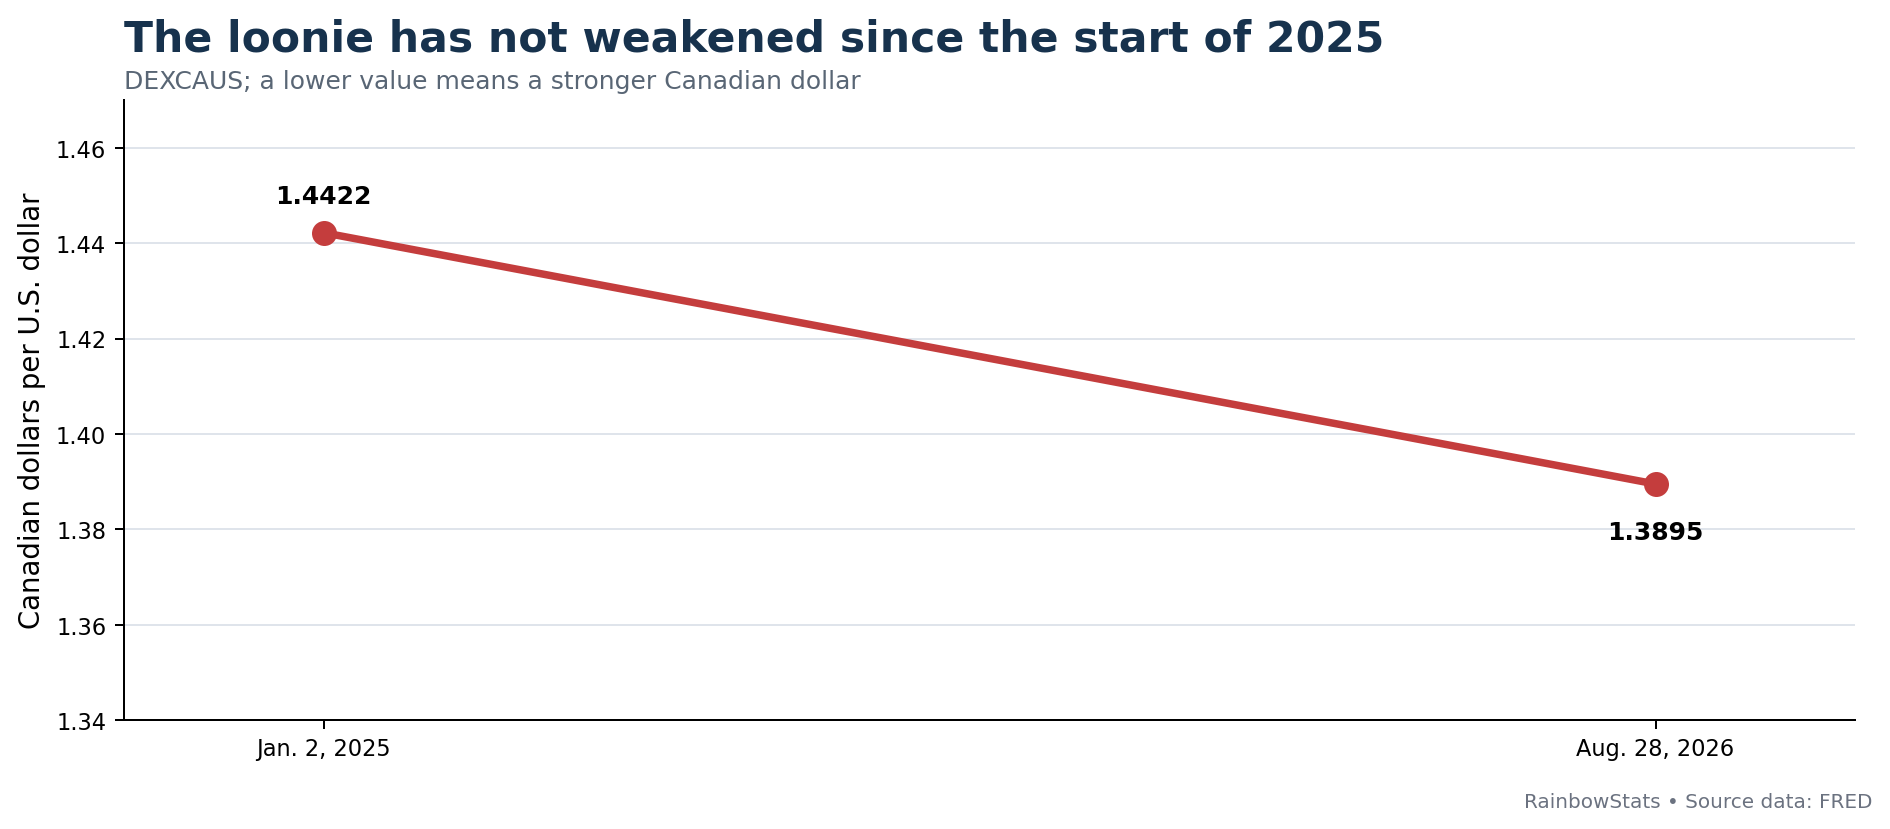
The currency tells a similarly restrained story. DEXCAUS is quoted as Canadian dollars per U.S. dollar, so a decline represents a stronger loonie. The rate moved from 1.4422 on January 2, 2025 to 1.3895 on August 28, 2026—an appreciation of approximately 3.7%. RainbowStats’ 90-day volatility study places recent annualized volatility near 4.1%, around the lower third of its historical distribution. Currency investors may dislike uncertainty, but they are not pricing a Canadian collapse.
Third, Europe is already a market—not a hypothetical rescue plan
Canada cannot redirect an entire continental trading relationship overnight. Supply chains, standards, transport costs and business networks adjust slowly. Yet the euro-area data show a platform on which diversification can build. Combined Canadian goods-and-services exports to the euro area rose from about €4.9 billion in 2013 Q1 to €10.1 billion in 2026 Q1. Imports from the euro area increased from approximately €8.4 billion to €15.8 billion.
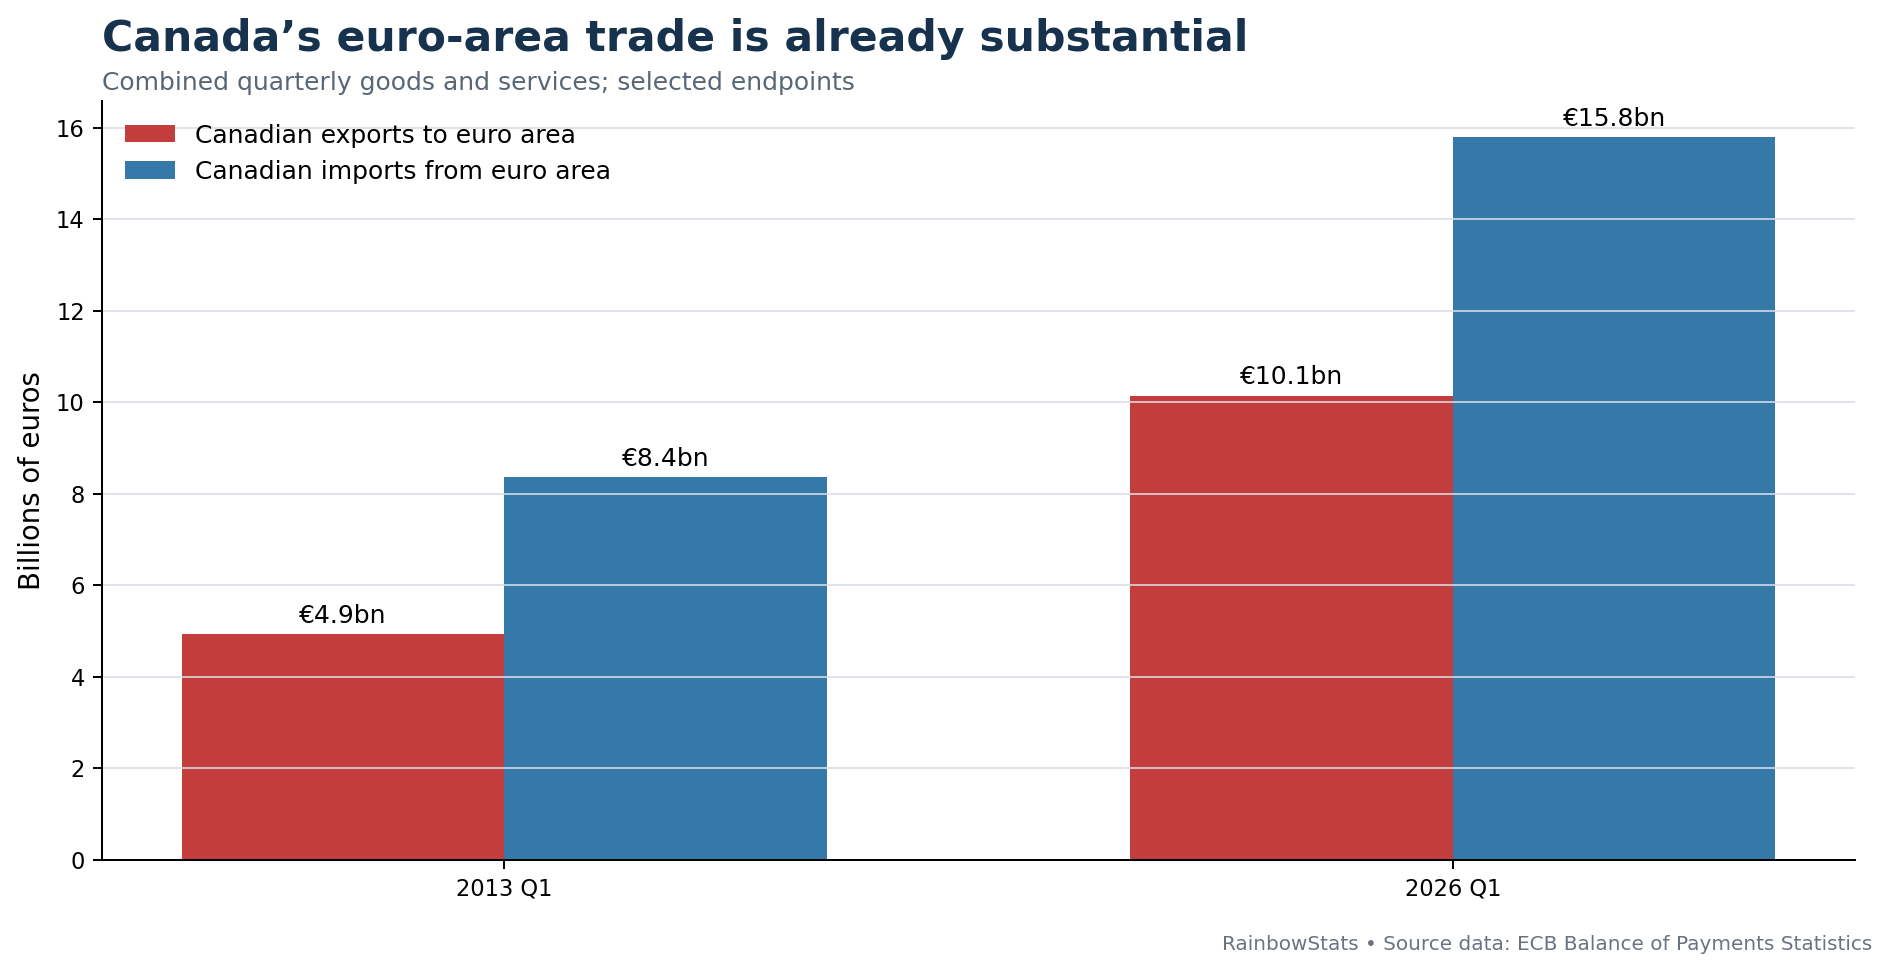
CETA matters here because diversification is easier when the legal architecture already exists. The European Commission reports that EU–Canada trade in goods and services reached roughly €130 billion in 2025, about 80% above its 2016 level, and that the agreement ultimately eliminates duties on 99% of tariff lines. Europe cannot instantly replace the U.S. market, but it gives Canada bargaining room and an established direction of travel.
On the morning this essay was completed, Bloomberg reported that Canada and the European Union were planning a far-reaching new alliance. The development reinforces what the trade data already suggested: Europe is not a theoretical substitute waiting somewhere in the future. Canada and the EU are actively building a broader partnership around trade, energy, security and resilient supply chains. American pressure may therefore accelerate the very diversification it was intended to prevent.
Bombardier reveals the problem with national labels
Bombardier is called a Canadian aircraft manufacturer, which is true but incomplete. The company says it employs about 3,500 people in the United States, buys from approximately 2,800 American suppliers in 47 states and spends more than $2.5 billion annually with those suppliers. Major inputs, including engines and wings, are produced in the United States. A restriction aimed at a “Canadian” company therefore reaches workers and firms throughout the American aerospace supply chain.
The President threatened to block Bombardier sales unless production moved to the United States. Reporting noted that the enforcement mechanism remained unclear and that earlier threatened measures had not been implemented. The analytically important point is not whether the latest threat becomes policy. It is that modern production networks do not respect the simple national categories used in political slogans.
| Evidence | What it supports | What it does not prove |
|---|---|---|
| U.S. export growth to Canada | The bilateral channel has recently underperformed total U.S. exports. | That tariffs alone caused the entire divergence. |
| Bond yields and the loonie | Markets are not displaying an obvious Canada-specific crisis signal. | That Canada faces no economic risk. |
| Euro-area trade | Canada has an established and growing non-U.S. commercial relationship. | That Europe can immediately replace the U.S. market. |
| Bombardier’s U.S. footprint | Restrictions on a Canadian firm can directly affect American employment and suppliers. | The precise cost of a policy that has not been fully specified. |
| Crude-oil imports | U.S. energy infrastructure is deeply dependent on Canadian supply. | That Canada alone determines U.S. energy prices. |
Finally, there is oil
This is the strongest graph in the study. In June 2010, the United States imported about 1.87 million barrels per day of Canadian crude, roughly 19.6% of total crude imports. By August 2026, Canadian imports had risen to approximately 4.01 million barrels per day while total U.S. crude imports had declined to 6.77 million. Canada’s share had reached 59.2%.
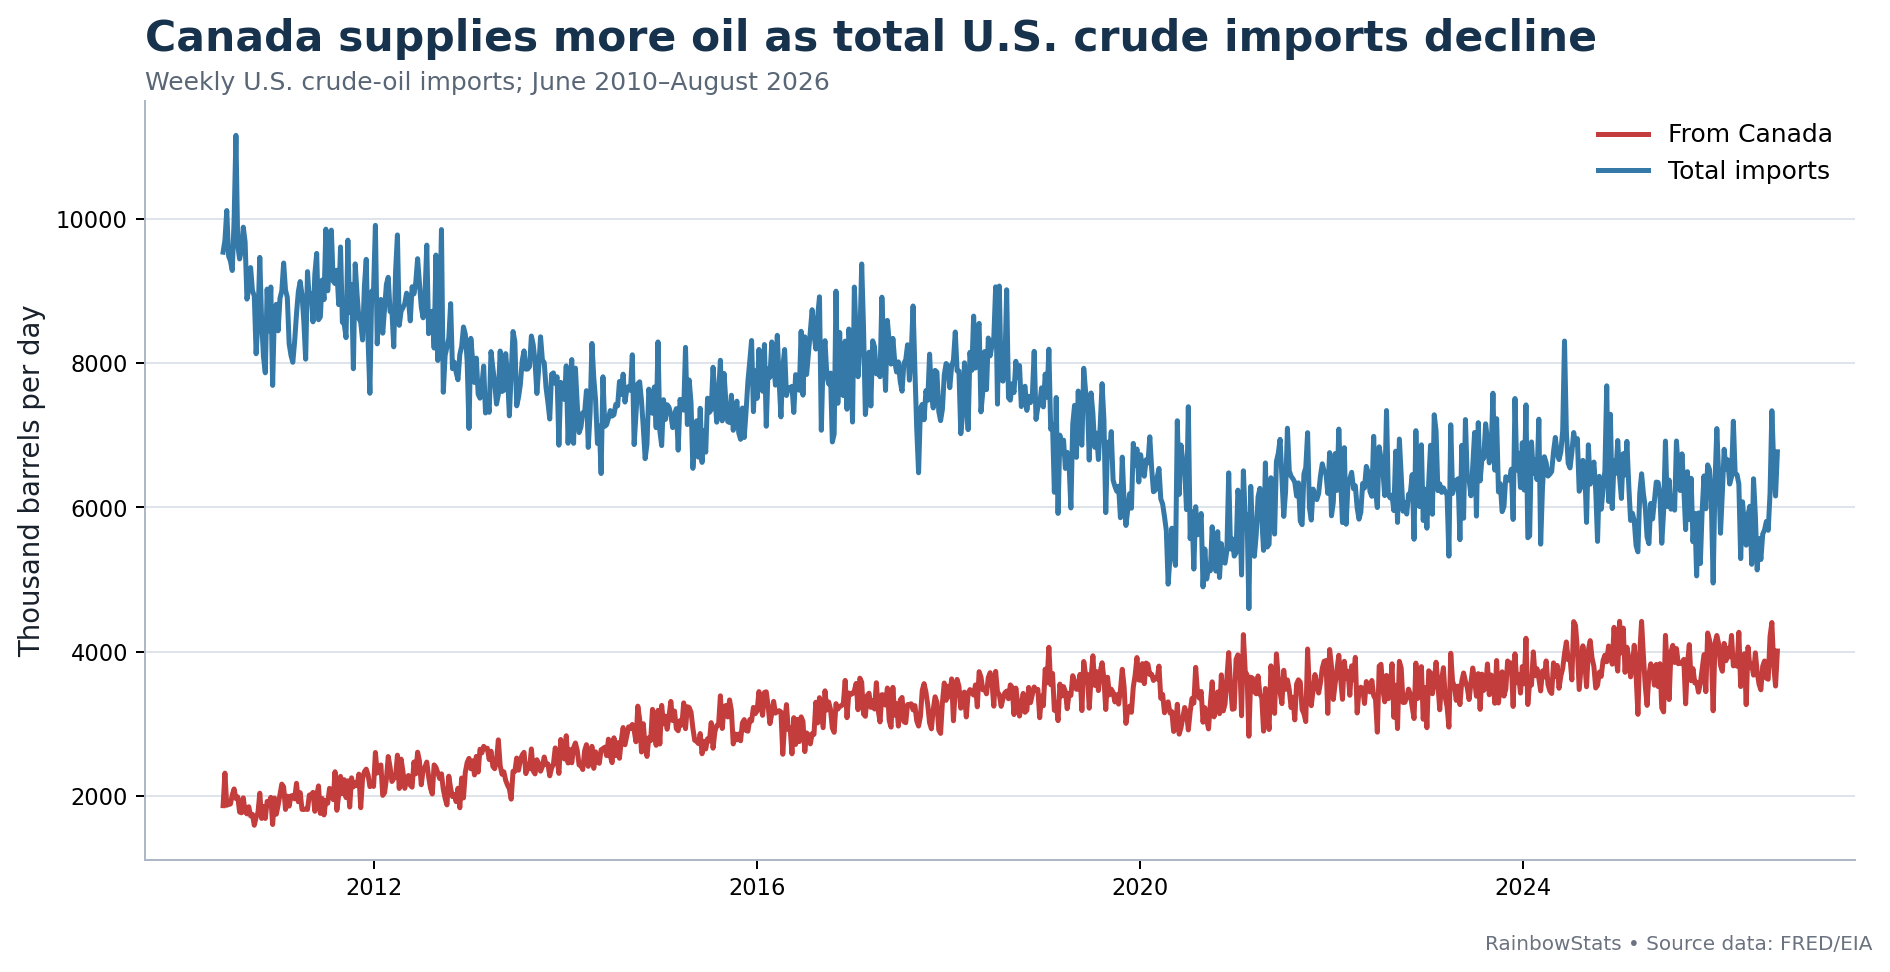
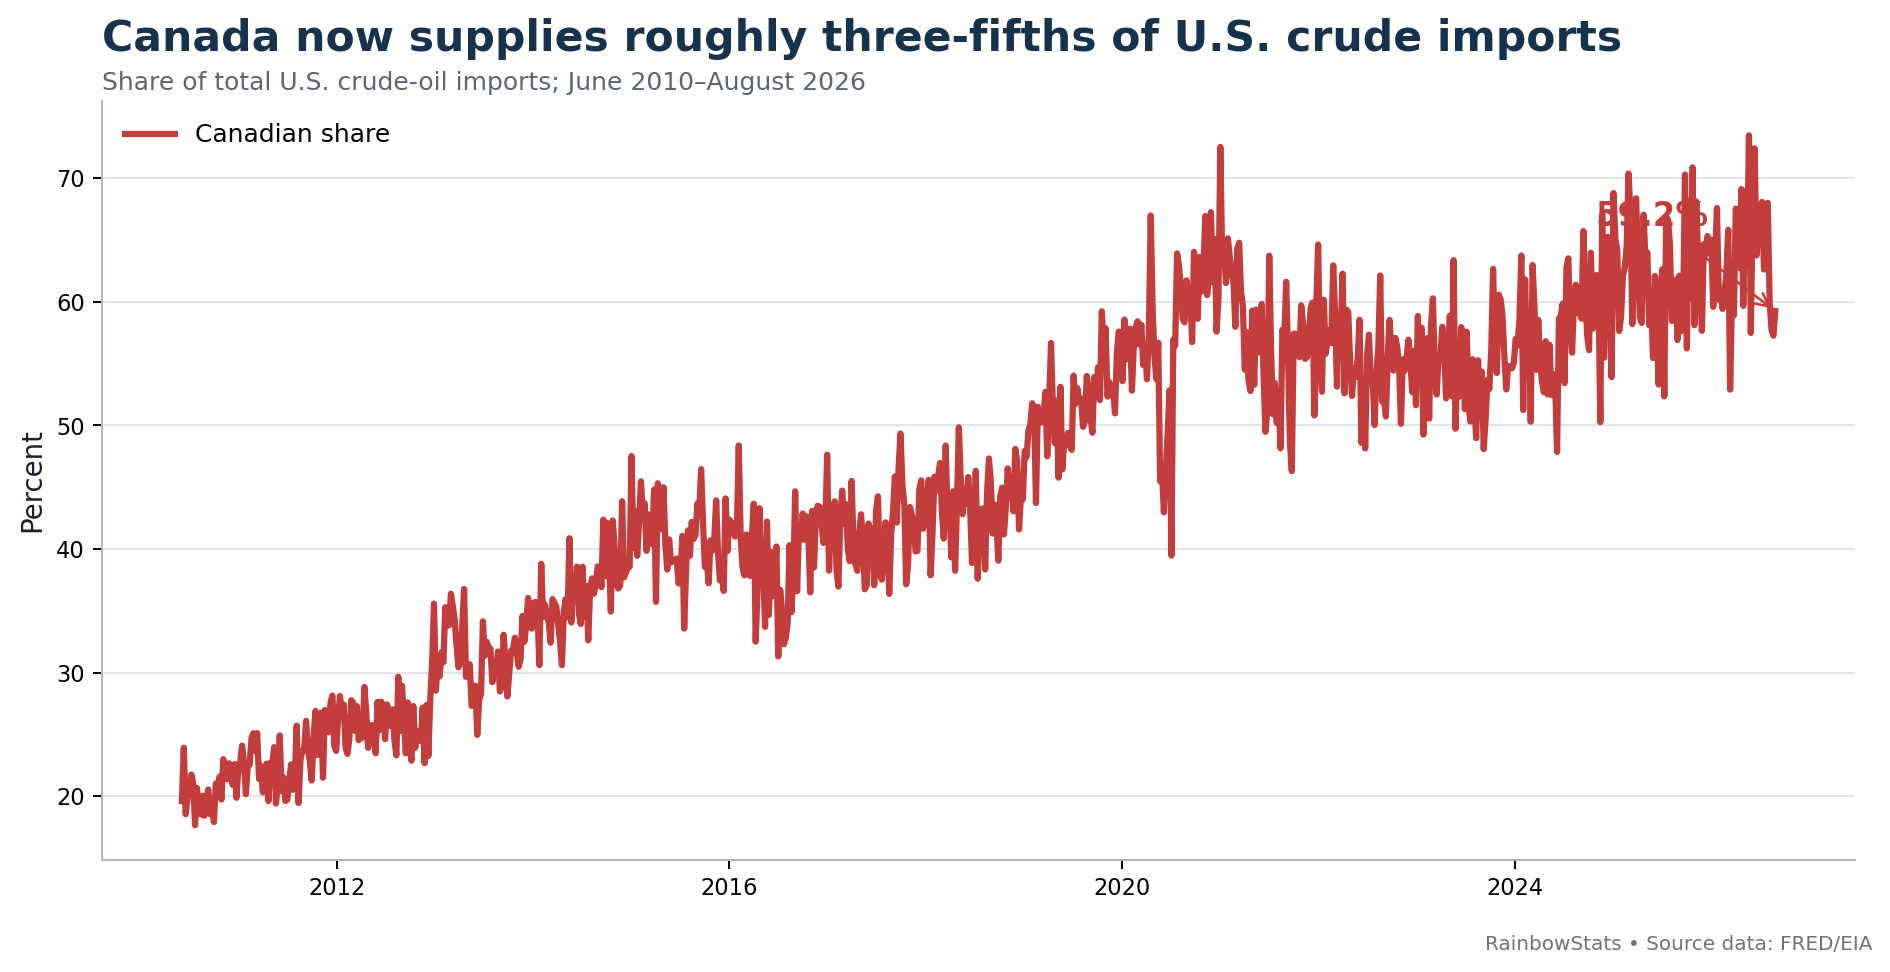
That concentration reflects infrastructure, not sentiment. Midwest refineries have invested in equipment suited to heavy, high-sulfur Canadian crude. BP’s large Whiting, Indiana refinery is a prominent example. Substitute barrels may exist, but replacing an established feedstock can require different logistics, different prices and costly operational adjustments. During an energy disruption, that physical relationship can matter far more than a social-media post.
The costs of coercion run in both directions
Canada is not invulnerable. It is deeply exposed to the United States, and diversification takes time. But vulnerability is not the same as helplessness. Canada has credible institutions, a sophisticated financial system, access to European markets, strategic natural resources and a government led by people experienced in financial crisis management.
The United States is also exposed—to Canadian customers, Canadian crude, cross-border aerospace production and the confidence on which alliances depend. Policies designed to demonstrate dominance can therefore produce the opposite strategic result: higher adjustment costs for American firms and a stronger Canadian incentive to build commercial relationships elsewhere.
Hayek’s enduring contribution was not a prediction that every provocation ends in tyranny. It was a warning against complacency about the institutions and habits that protect a free society. Territorial “jests” deserve scrutiny for the same reason. Sovereign democracies can disagree sharply over trade. Treating one another as props in fantasies of absorption is something different—and the economic evidence suggests that the fantasy badly misunderstands the balance of dependence.
Sources and replication
- RainbowStats: replicate the complete Canada–United States study.
- Associated Press: the territorial map post and diplomatic reaction; Reuters: Iceland summons the U.S. ambassador.
- University of Chicago Press: The Road to Serfdom.
- Bank of Canada: Mark Carney’s education and appointment.
- European Commission: EU–Canada trade and CETA; ECB Balance of Payments Statistics.
- Reuters: Bombardier threat and U.S. industrial footprint; Associated Press: Bombardier’s suppliers and Kansas employment.
- FRED: DEXCAUS exchange rate; EXPCA exports to Canada; Canadian 10-year yield; U.S. 10-year yield.
- U.S. Energy Information Administration: petroleum import data.