Machine learning is extraordinarily powerful. That statement hardly needs defending. I am writing this article while conversing with a machine using the @RainbowStats plugin.
But the success of machine learning creates its own temptation. When a sophisticated algorithm can uncover nonlinear relationships, interactions and conditional distributions that would be difficult to specify by hand, it becomes easy to jump immediately to the sophisticated model.
Students of economics and data science should resist that temptation. Before reaching for the Random Forest, it is worth running the regression. Don't forget BLUE.
The BIS question that piqued our interest
The motivation comes from BIS Bulletin No 136, High public debt, NBFIs and the risk of market dysfunction, by Mathias Drehmann and Sonya Zhu. The BIS highlights how elevated public debt and the growing role of non-bank financial institutions can reshape government bond market functioning. The related BIS Working Paper No 1250, Predicting financial market stress with machine learning, uses tree-based machine learning to forecast the full distribution of market stress.
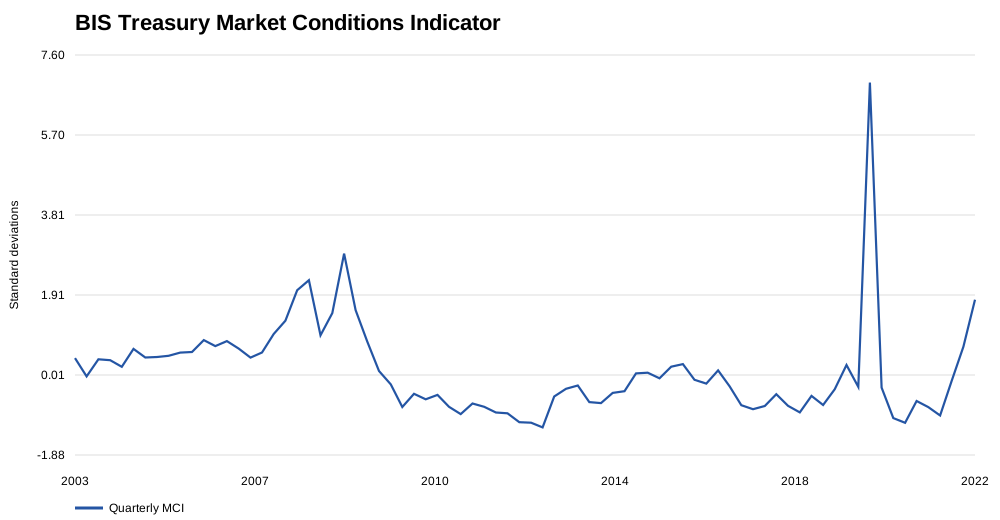
Our objective is deliberately different. We are not reproducing the BIS specification. We use the Treasury Market Conditions Indicator and a small public-data specification as a teaching laboratory: what do we learn from OLS before we introduce Random Forest and Quantile Random Forest?
Model one: start with OLS
Consider the classical linear model:
OLS chooses the coefficient vector that minimizes the sum of squared residuals:
with the familiar solution:
What BLUE means
Under the Gauss–Markov assumptions, OLS is the Best Linear Unbiased Estimator. “Unbiased” means E(β̂|X)=β. “Best” means minimum variance among linear unbiased estimators under those assumptions. With homoskedastic uncorrelated disturbances,
That variance is not an accessory to the prediction. It is information. It gives us standard errors, t-statistics, confidence intervals and tests of hypotheses.
OLS results
| Variable / statistic | Estimate | Std. error | t-statistic |
|---|---|---|---|
| Constant | -2.161 | 0.999 | -2.163 |
| Federal debt held by public / GDP | -0.029 | 0.0067 | -4.316 |
| NBFI share of Treasury securities | 0.183 | 0.051 | 3.575 |
| R² | 0.226 | ||
| Adjusted R² | 0.194 | ||
| Durbin-Watson | 1.612 | ||
| Observations | 76 |
The signs themselves generate questions. The NBFI coefficient is positive; the debt coefficient is negative in this deliberately small contemporaneous specification. The wrong response is to force either result into a preferred narrative. The useful response is to ask why.
Model two: Random Forest
For tree b, let its prediction be f̂b(x). The forest prediction averages B trees:
The attraction is obvious: nonlinearities and interactions can emerge without specifying their exact form beforehand. But flexible models should have to earn that flexibility out of sample.
| Benchmark | Random Forest | OLS |
|---|---|---|
| In-sample RMSE | 0.823 | 1.002 |
| In-sample R² | 0.479 | 0.226 |
| Validated RMSE | 1.035 (OOB) | 1.086 (LOOCV) |
| Validated R² | 0.175 (OOB) | 0.091 (LOOCV) |
| Incremental validated R² | 0.084 | |
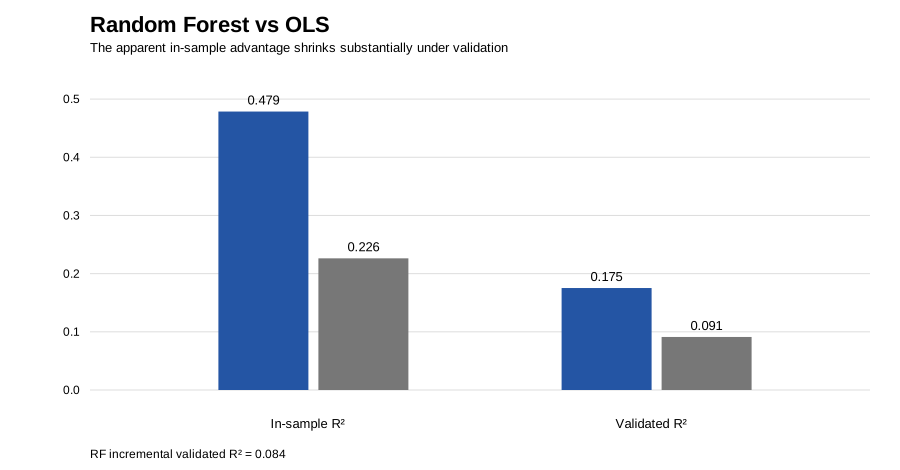
This is a better lesson than declaring a winner. Random Forest finds incremental predictive information. Yet OLS tells us directly about signs, magnitudes, uncertainty and residual behavior. Variable importance is useful for prediction, but it is not a coefficient, a standard error or a hypothesis test.
Model three: Quantile Random Forest
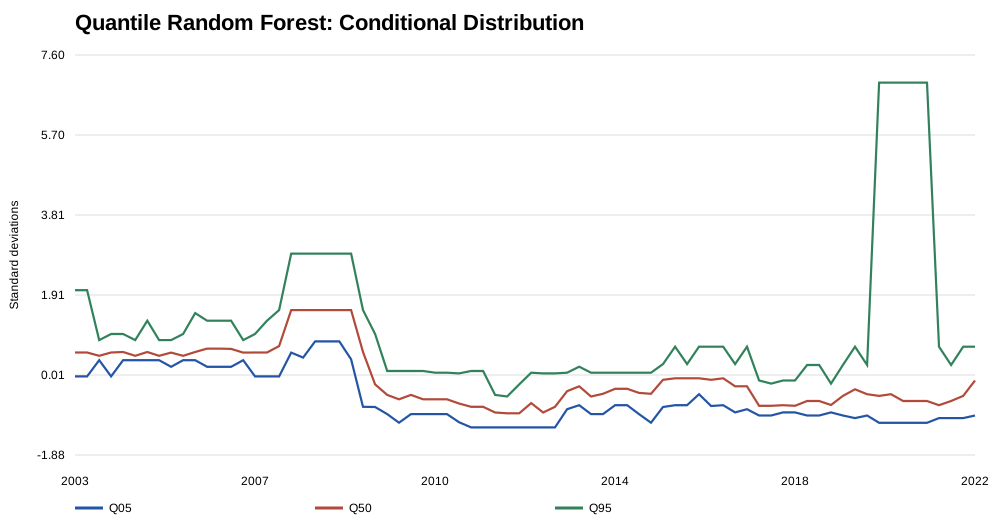
The BIS problem also shows why machine learning can be genuinely valuable. Market dysfunction is a tail problem. Instead of asking only about E(Y|X=x), Quantile Random Forest estimates conditional quantiles Qτ(Y|X=x), where
RainbowStats estimates Q05, Q50 and Q95. Now machine learning is not merely competing with OLS for another increment of mean R². It is answering a different question about the conditional distribution.
Three models, three questions
OLS: What relationship have we estimated? What are the signs and magnitudes? How uncertain are they? What do the residuals tell us?
Random Forest: Is there nonlinear predictive information that survives an out-of-sample test?
Quantile Random Forest: Does the conditional distribution—especially its tails—contain economically important information that a mean regression cannot show?
Prediction is not inference
Machine learning and econometrics need not be competitors. The mistake is allowing prediction to silently replace inference. An algorithm may produce an excellent prediction and still leave an economist asking why, in what direction, with what uncertainty, under what assumptions, and whether the residuals reveal structure the model has not explained.
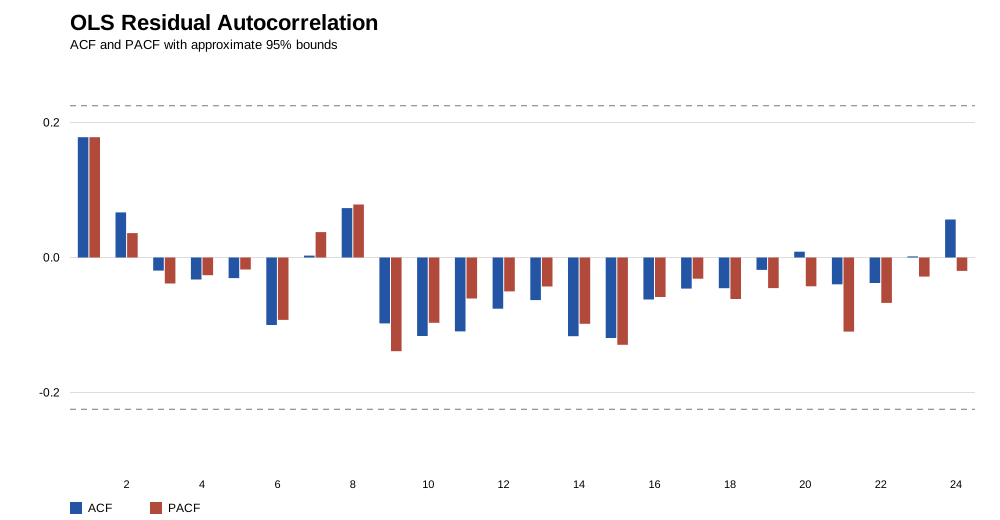
That is why the autocorrelation chart belongs near the center of this article. Forests can be powerful precisely because they absorb complex structure. But that power can also hide familiar statistics. Classical econometrics trains us to look at the errors, not merely the fit.
Don't Forget BLUE
The useful workflow is not OLS versus machine learning. It is:
Start with the transparent model. Understand the signs. Measure the uncertainty. Inspect the residuals. Then allow the nonlinear model to challenge the linear specification and require it to demonstrate value out of sample. If the economic problem concerns extreme outcomes, let the quantile model examine the part of the conditional distribution that the mean cannot see.
Use machine learning enthusiastically. But before turning 1,000 trees loose on the data, run the regression. Look at the coefficients. Look at the standard errors. Look at the residuals. Ask what assumptions you are making and what question the model is actually answering.
Don't forget BLUE.
References and replication
Drehmann, Mathias and Sonya Zhu (2026), “High public debt, NBFIs and the risk of market dysfunction,” BIS Bulletin No 136, 29 September 2026. BIS publication.
Aldasoro, Iñaki, Peter Hördahl, Andreas Schrimpf and Sonya Zhu (2025), “Predicting financial market stress with machine learning,” BIS Working Paper No 1250. BIS working paper.
RainbowStats analysis and slideshow.
This RainbowStats exercise is intentionally not a reproduction of the BIS specification. It is a teaching experiment using BIS-inspired Treasury-market data to compare the information obtained from OLS, Random Forest and Quantile Random Forest on a common sample.