COVID Broke the Fit, Not the Relationship
A very high R² should make you suspicious before it makes you happy.
I began with a simple RainbowStats search for commercial-bank delinquency rates. I removed an obsolete historical series, placed the unemployment rate first, took log differences, and allowed a Bayesian information criterion search to choose the explanatory variables. The COVID-adjusted regression returned an R² above 0.90.
For quarterly macroeconomic changes, that is almost too good. It was.
COVID captured the fit
Using aggregate delinquencies alone, the full-sample COVID-adjusted regression produced an R² of 0.920. When the sample ended in 2019, the R² fell to 0.115. COVID did not reveal a model capable of explaining nine-tenths of normal unemployment movements. It supplied one enormous discontinuity that the adjustment identified almost perfectly.
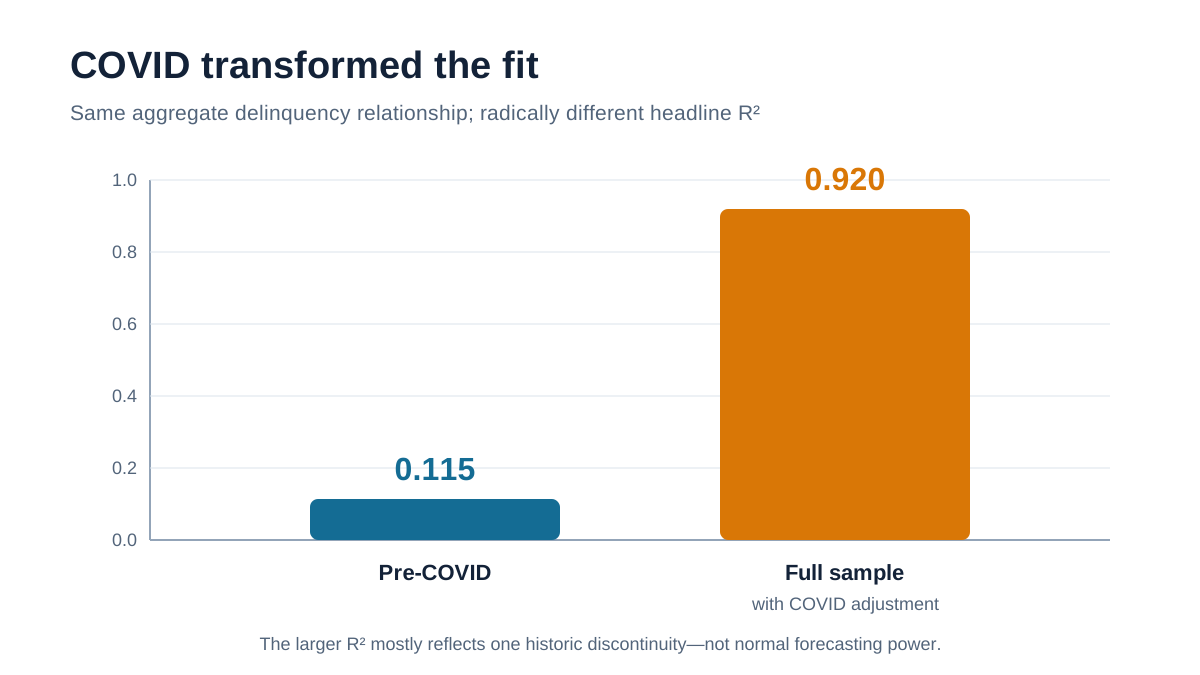
That sounds like bad news, but the more important result appeared in the coefficient rather than the fit.
The beta survived
Before COVID, the coefficient on aggregate delinquency growth was 0.151, with a t-statistic of 4.21. In the full sample with the COVID adjustment, it was 0.146, with a t-statistic of 3.75. The estimates differ by only 0.005—about three percent of the pre-COVID value.
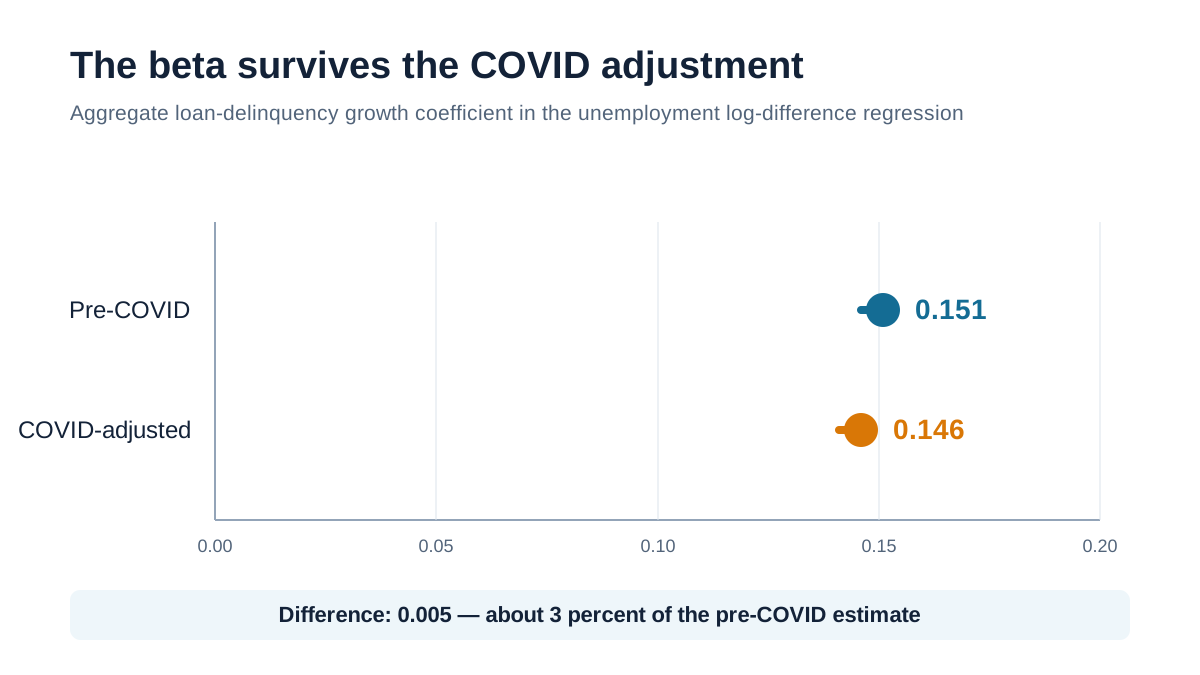
| Specification | Aggregate beta | t-stat | R² |
|---|---|---|---|
| Pre-COVID, 1985–2019 | 0.151 | 4.21 | 0.115 |
| Full sample, COVID-adjusted | 0.146 | 3.75 | 0.920 |
Regression order is not economic direction
The first regression treated unemployment as the dependent variable because unemployment appeared first in the data list. That is a computational choice, not a causal finding. The more plausible mechanism runs in the opposite direction: people lose jobs or income, and then some fall behind on their loans.
Reversing a simple two-variable contemporaneous regression does not prove causality. With the same observations, it produces the same R² and t-statistic. It merely puts the equation in the economically sensible orientation. To investigate timing, we need a transfer function.
Unemployment moves first
The pre-COVID transfer function treated delinquency rates as the output and unemployment as the input. After ARIMA filtering, unemployment innovations had a positive contemporaneous effect on aggregate delinquencies and another positive effect one quarter later. Consumer-loan delinquencies responded principally after one quarter.
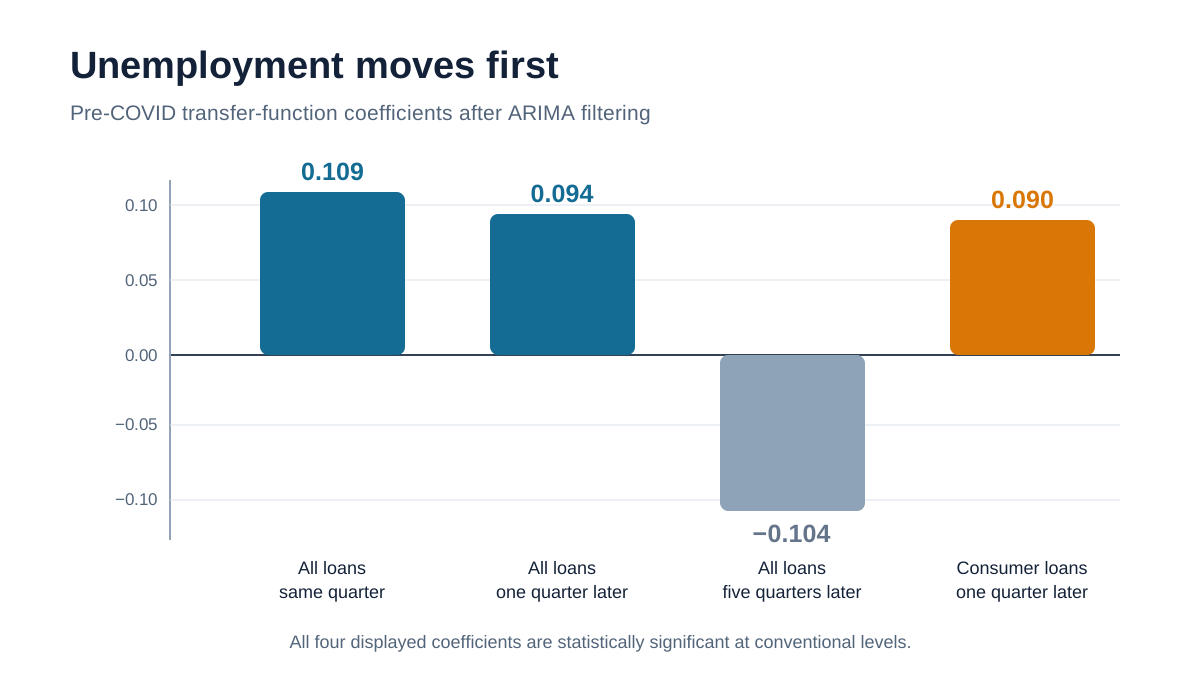
| Delinquency output | Unemployment input | Coefficient | t-stat |
|---|---|---|---|
| All loans | Same quarter | 0.109 | 2.94 |
| All loans | Lagged one quarter | 0.094 | 2.52 |
| All loans | Lagged five quarters | −0.104 | −2.76 |
| Consumer loans | Lagged one quarter | 0.090 | 2.43 |
This is evidence about temporal ordering, not final proof of causation. Both unemployment and delinquencies respond to the business cycle, credit conditions, household balance sheets, and policy. Still, the result is consistent with the basic mechanism: unemployment deteriorates first; loan performance follows.
Automated selection still needs judgment
When consumer-loan, credit-card, and all-loan delinquency rates entered together, the overlap among them destabilized the coefficients. Consumer delinquencies even acquired a negative conditional sign. Once the aggregate series was removed, that negative coefficient shrank and became insignificant.
Limiting the BIC search to one explanatory variable helped, but the selected series changed with the sample: the COVID-adjusted full sample favored consumer-loan delinquencies, while the pre-COVID sample favored the aggregate rate. That is not a failure of selection. It is a reminder that selection answers the question encoded in the sample—and structural breaks can change the question.
Transfer-function specification note
TRANSFER_FUNCTION performs its own ARIMA filtering and differencing. Supplying an already log-differenced series caused the routine to difference unemployment again and produced a misleading negative two-quarter result. The final analysis therefore passes the original rates to the transfer function. The reported seasonal period should also be verified as quarterly rather than a hard-coded 12 before treating the ARIMA details as final.
Replication script
l=SEARCH(delinquency_Rate)
l=REMOVE(l,Q09084USQ507NNBR)
l=LIST(UNRATE,l)
selected=BEST_BIC_COVID_REGRESSION(LOGDIFF(l),1)

aggregate=LIST(UNRATE,DRALACBS)
adjusted=BEST_BIC_COVID_REGRESSION(LOGDIFF(aggregate),1)

preCovid=SERIES_BETWEEN(aggregate,19850101,20191231)
preCovidModel=REGRESSION(LOGDIFF(preCovid))

transferData=LIST(DRALACBS,UNRATE)
transferPreCovid=SERIES_BETWEEN(transferData,19850101,20191231)
transferModel=TRANSFER_FUNCTION(transferPreCovid)
The lesson
COVID did not merely add a large residual. It created a different regime capable of dominating an otherwise ordinary macroeconomic regression. A dummy or nonlinear adjustment can isolate that disruption, but the resulting R² should not be mistaken for normal explanatory power.
The better test is whether the economically meaningful coefficient survives. Here it did. The aggregate delinquency beta remained almost unchanged, and the transfer function placed unemployment before the subsequent deterioration in loan performance.
Econometrics organized the evidence. Economic reasoning supplied the direction.
Data: Federal Reserve Economic Data: UNRATE, DRALACBS, DRCLACBS, and DRCCLACBS.