One Oddity Is Noise. Four Deserve Attention.
What the August 2026 jobs report looks like after stripping away the headline
The August employment report delivered a number that was difficult to ignore: 162,000 new nonfarm payroll jobs. That was exactly three times the consensus forecast of 54,000 and far stronger than our estimate published before the release.
The natural reaction was to declare that the labor market had suddenly reaccelerated. But that conclusion requires more confidence than one preliminary estimate can carry—especially when several details inside and around the report point in a different direction.
This is not an argument that the Bureau of Labor Statistics produced a false number. Seasonal adjustment is necessary, surveys contain sampling error, and preliminary estimates are revised as more information arrives. The narrower question is whether the headline provides convincing evidence of a broad hiring boom.
After examining the raw payroll counts, the size of the August seasonal adjustments, the concentration of the reported gains, independent payroll data and Canada’s simultaneous employment decline, my answer is: not yet.
The headline depended heavily on seasonal adjustment
The distinction between raw and seasonally adjusted employment is essential. Payrolls regularly follow seasonal patterns as schools close and reopen, summer jobs end, and businesses alter staffing around holidays. A raw August decline can therefore become an adjusted increase without anything improper occurring.
What deserves attention is the size of that transformation compared with earlier August observations.
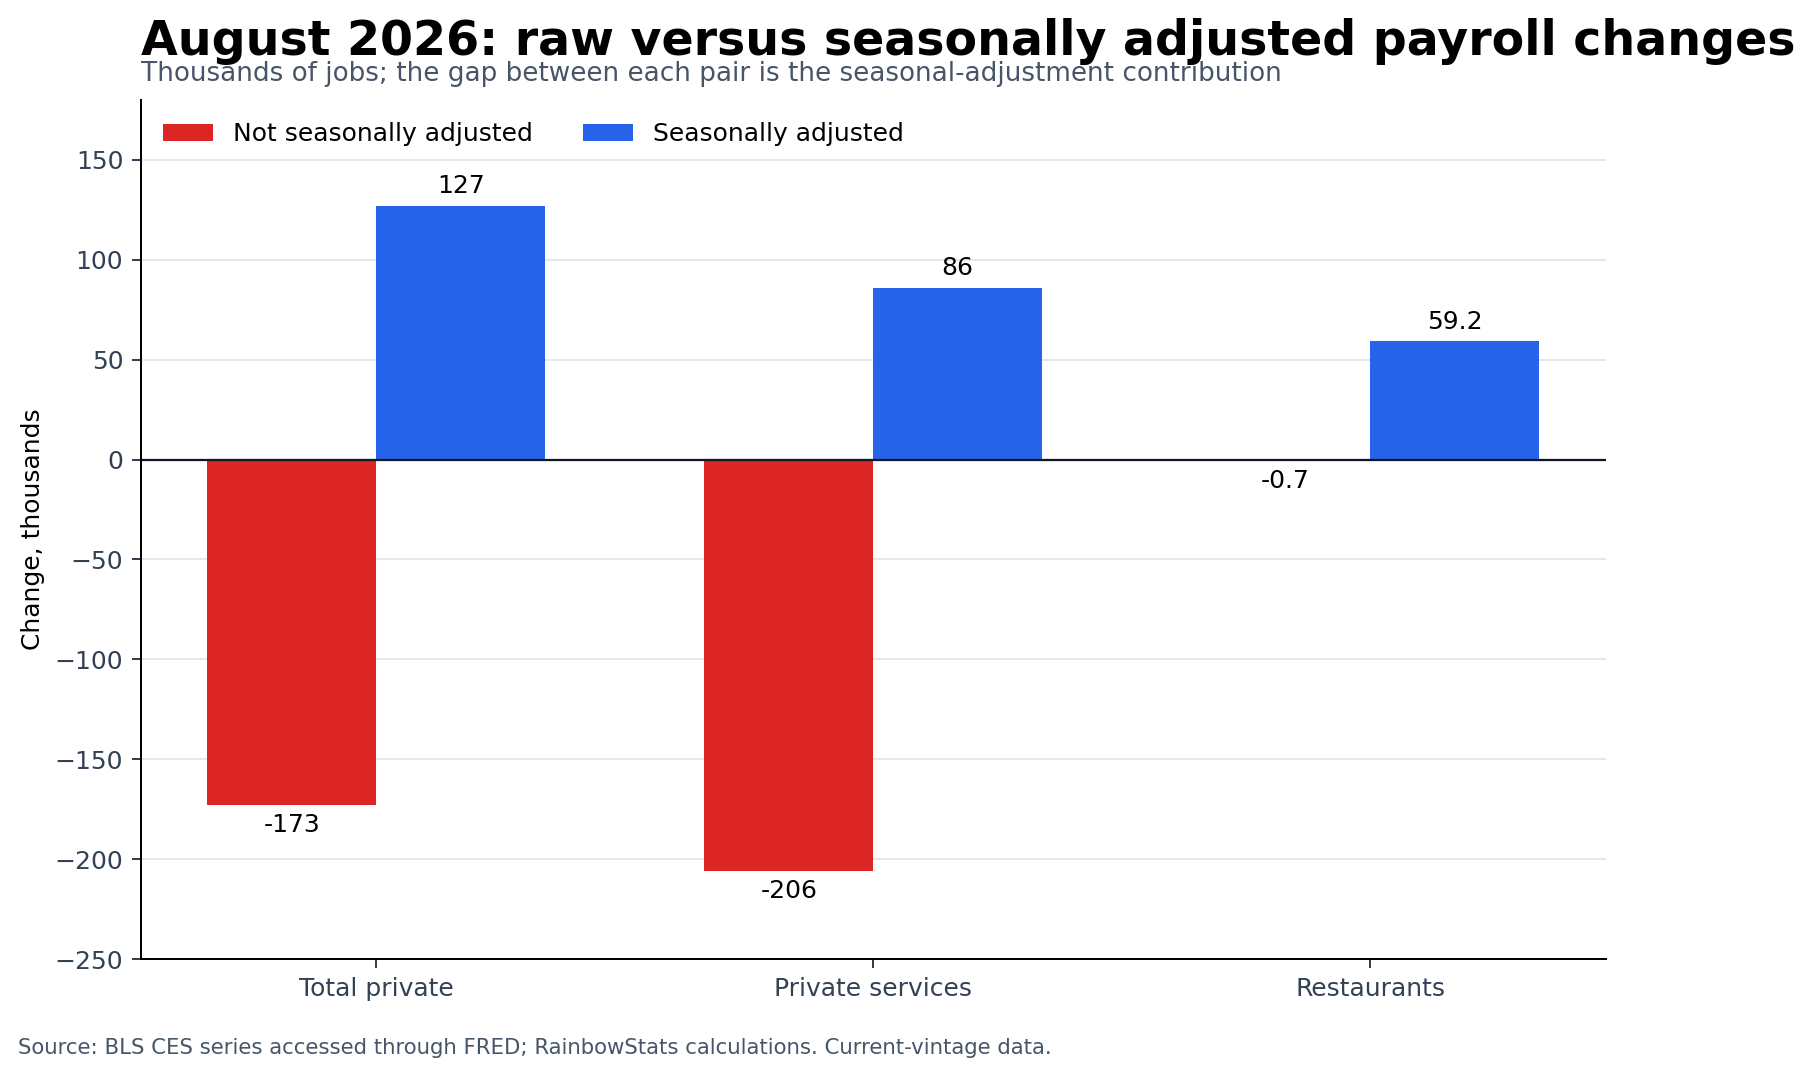
For total private employment, the raw payroll count fell by approximately 173,000 while the seasonally adjusted series rose by 127,000. The adjustment contribution was therefore about +300,000 jobs.
Private-service payrolls fell approximately 206,000 before adjustment but increased 86,000 after adjustment, producing a +292,000 transformation. Restaurant payrolls fell by roughly 700 in the raw data but rose 59,200 after adjustment—a difference of 59,900.
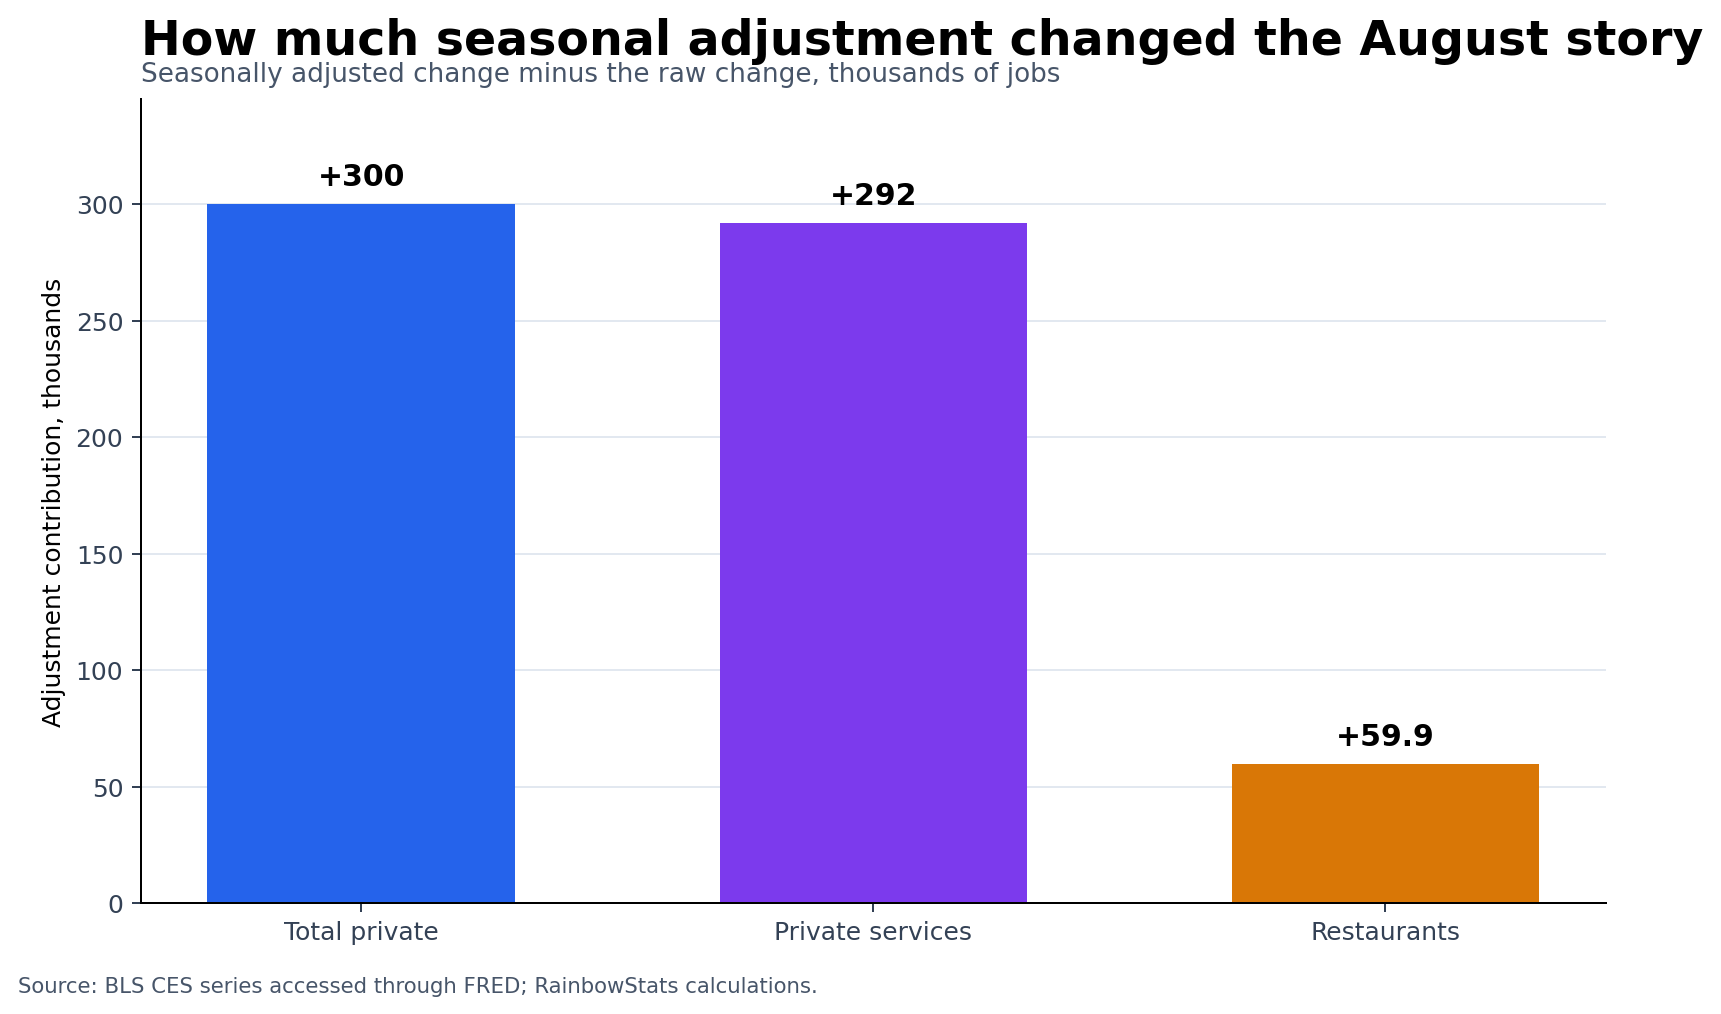
RainbowStats compared those transformations with August observations from 2000 through 2025 using current-vintage FRED data:
- Total private: historical August mean +50,900, standard deviation 109,400; August 2026 was +2.28 standard deviations.
- Private services: historical mean +94,700, standard deviation 73,400; August 2026 was +2.69 standard deviations.
- Restaurants: historical mean +5,100, standard deviation 24,700; August 2026 was +2.22 standard deviations.
The total-private and private-service adjustment contributions were the largest August values in this sample. The restaurant adjustment was the second largest. Historical rankings can change when the agencies revise the underlying series, but the current-vintage result is unambiguous: August required unusually large seasonal transformations.
The gains were concentrated
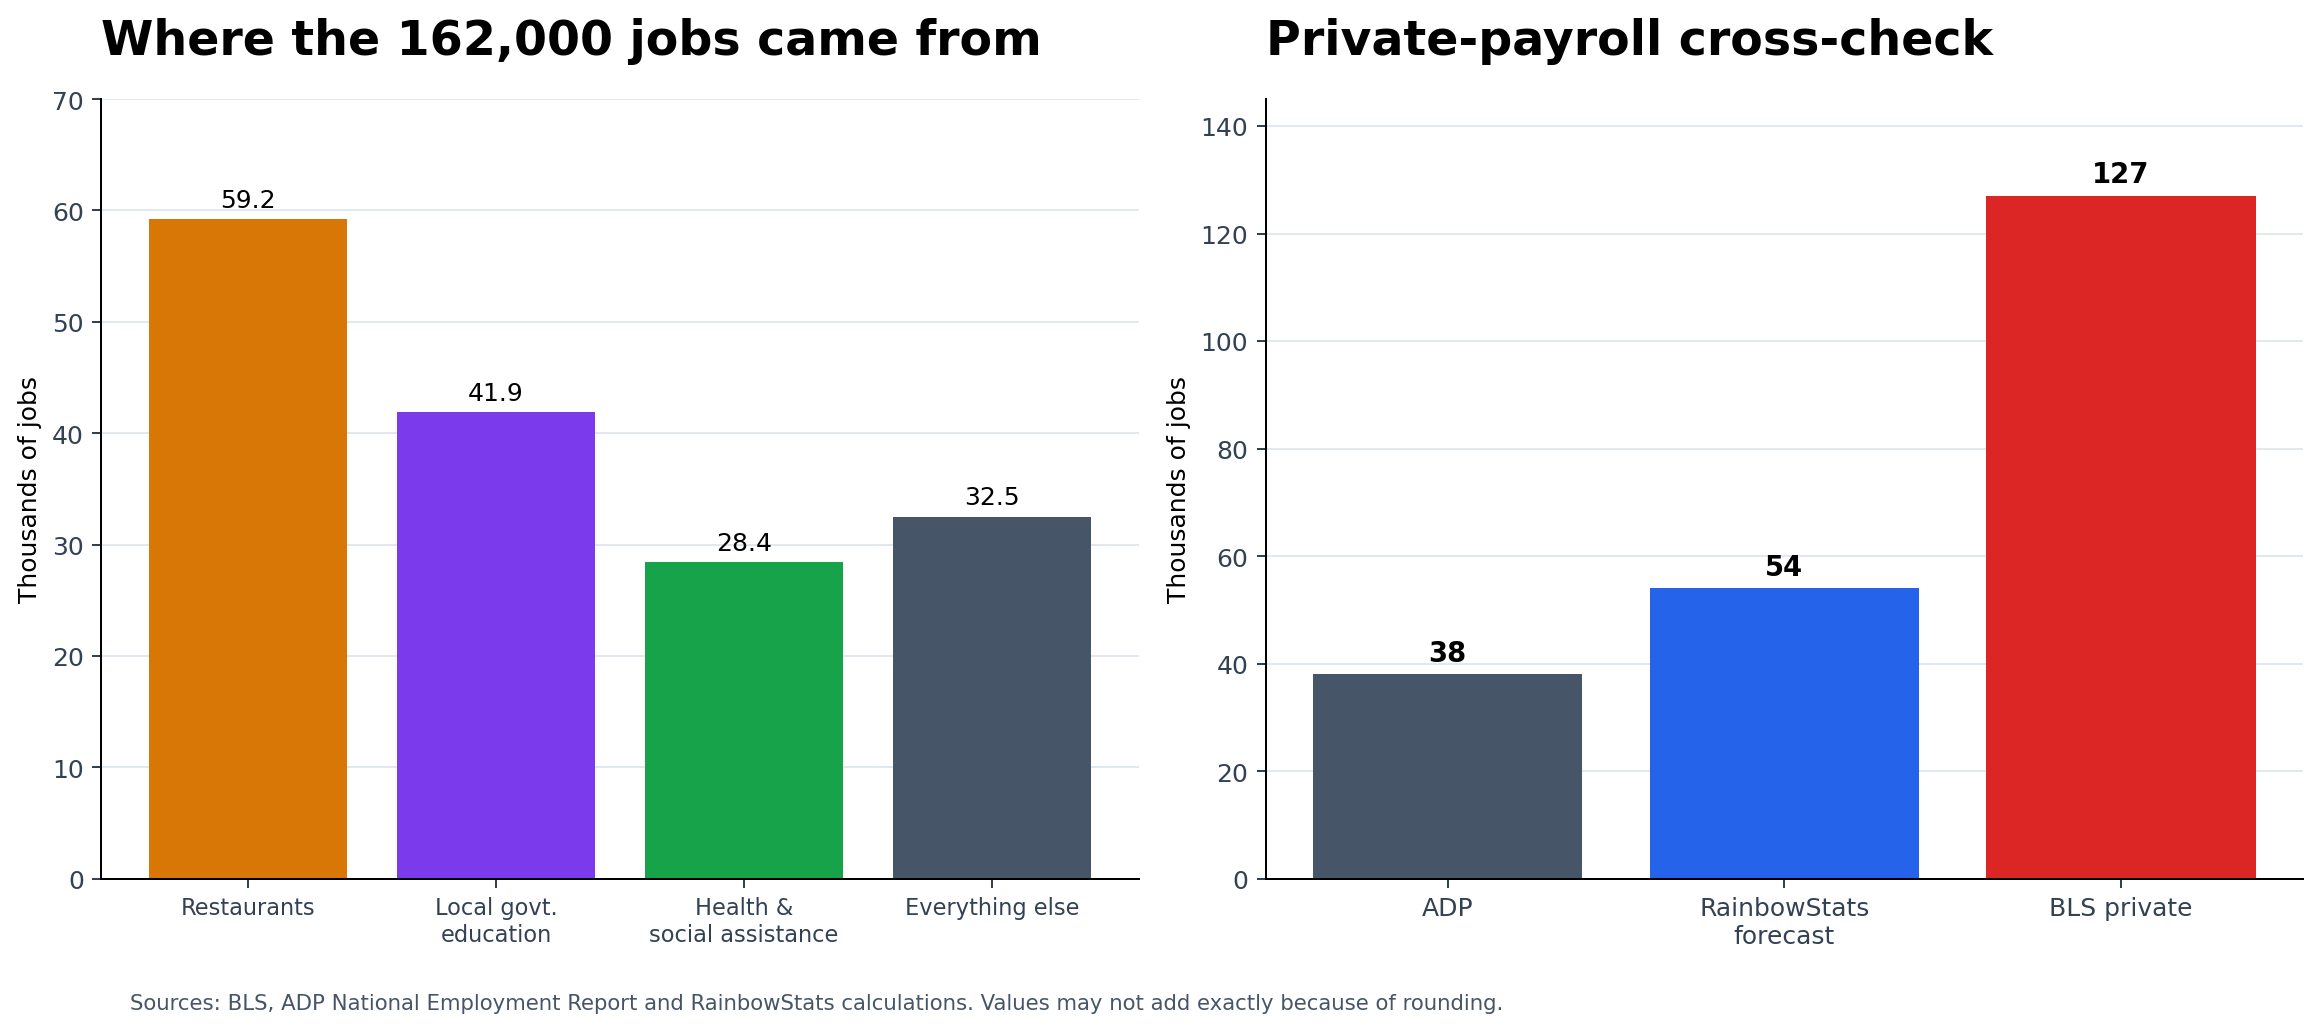
The composition of the 162,000 increase matters as much as the total. Restaurants contributed approximately 59,200 jobs, local-government education 41,900, and health care and social assistance 28,400. Together, those three categories accounted for 129,500 jobs, or 79.9% of the headline. Everything else combined supplied approximately 32,500.
The same concentration appears inside private services. Leisure and hospitality added approximately 62,000 jobs, while private education and health added about 29,000. Yet total private-service employment increased only 86,000. The remainder of the enormous private-service economy therefore contracted by roughly 5,000 jobs.
That is positive payroll growth, but it is not broad payroll growth.
Several internal and external checks did not confirm a boom
ADP estimated that private employers added only 38,000 jobs in August—the slowest pace since January—while the BLS establishment survey reported 127,000 private jobs. ADP and BLS use different samples and methods, so disagreement is possible. Still, a difference of 89,000 does not provide independent confirmation of sudden acceleration.
The internal details were mixed as well. Manufacturing employment increased by 16,000 in the headline series, while production and nonsupervisory manufacturing employment fell by approximately 7,000. Household employment rose sharply, but the change remained below the BLS threshold of roughly 650,000 for monthly statistical significance. Labor-force participation was 61.6%, the employment-population ratio was 59.1%, and average unemployment duration increased to 26.3 weeks.
These observations do not prove the payroll estimate wrong. They do make the phrase “hiring boom” difficult to defend.
Canada supplied another divergence
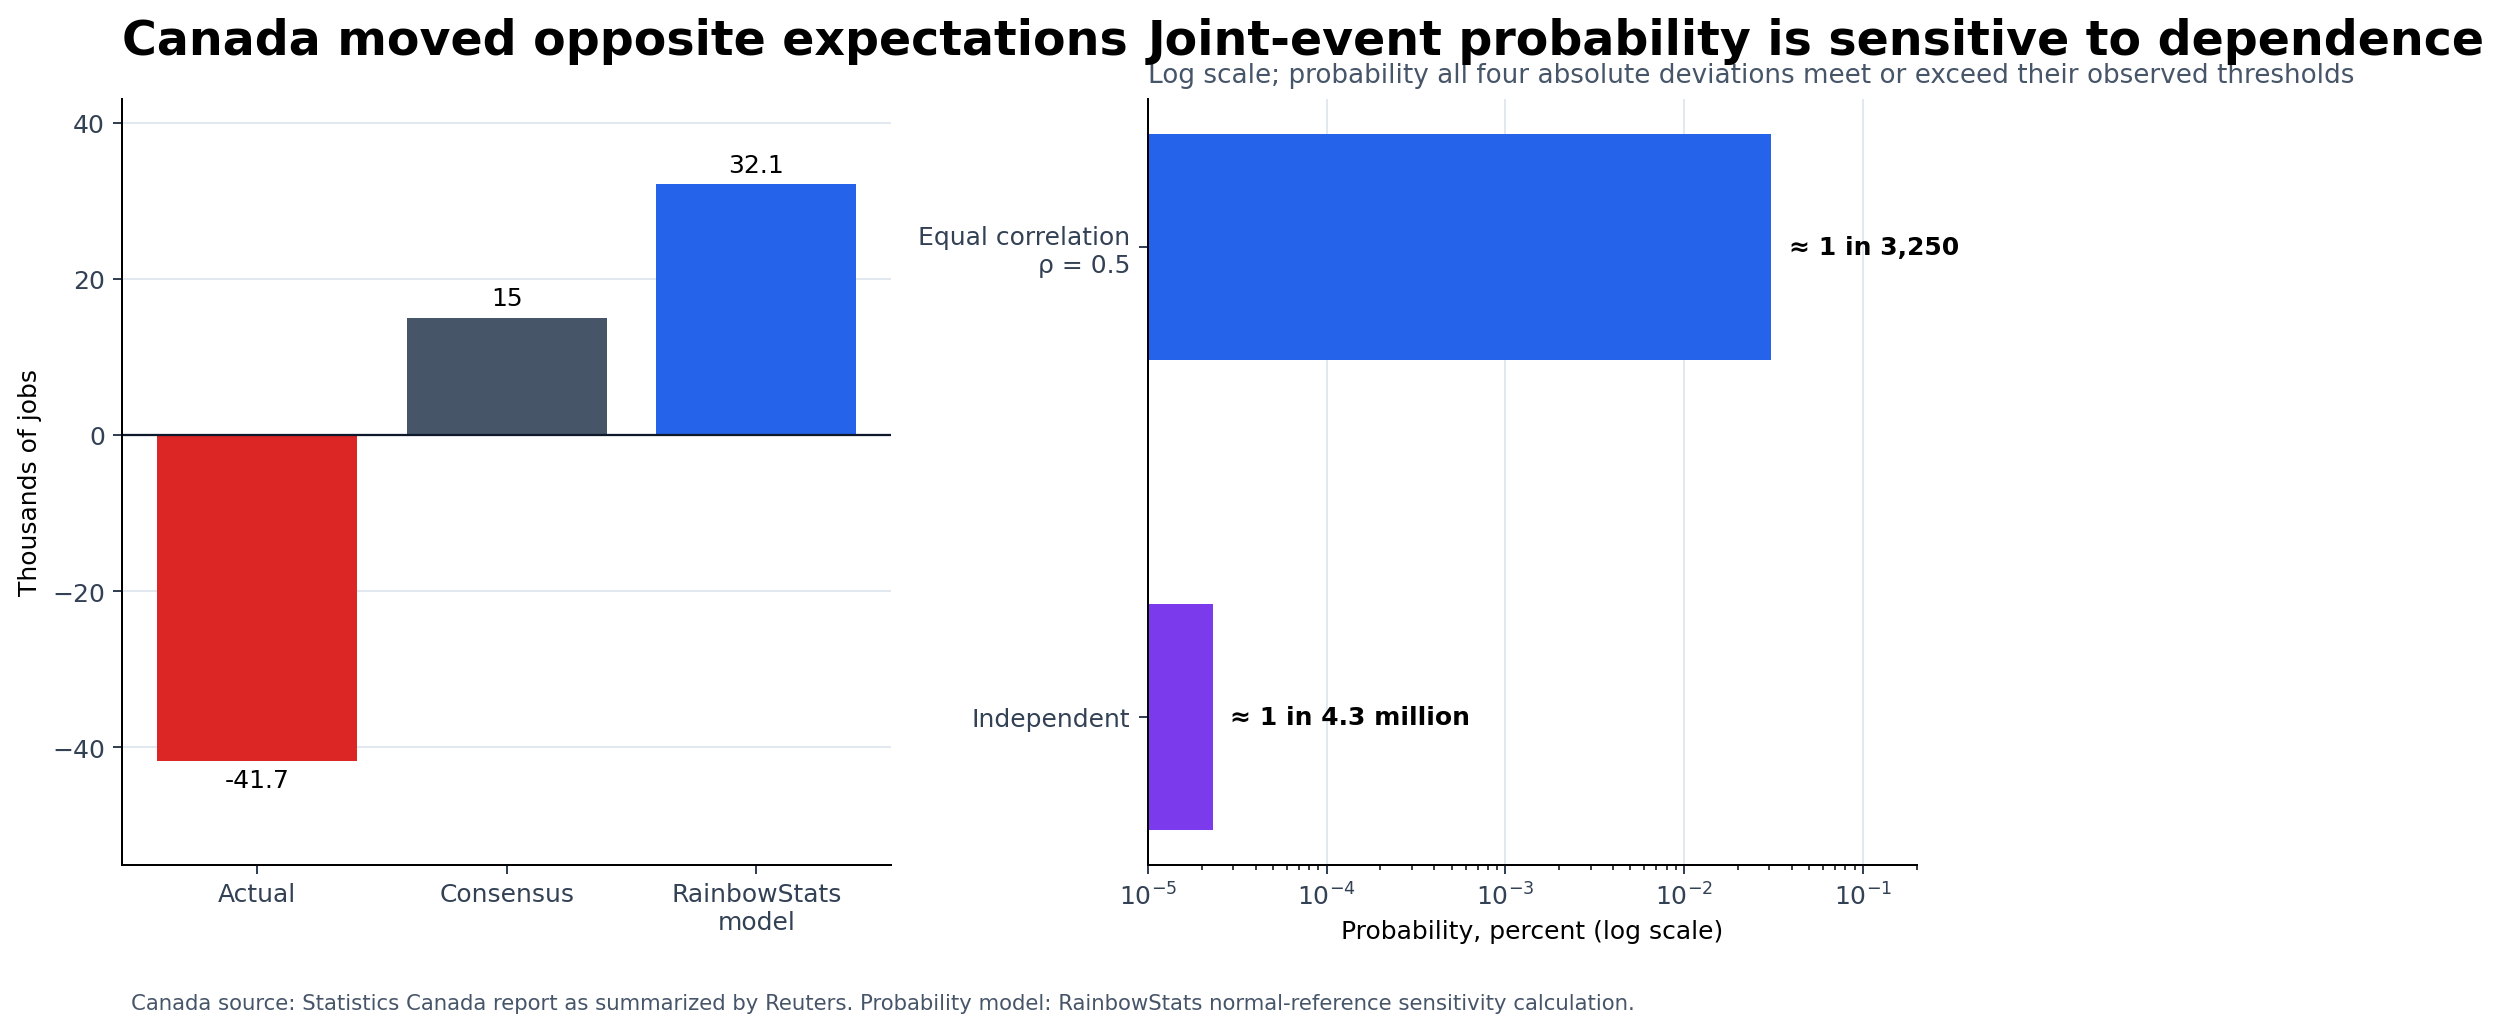
On the same morning, Canada reported a loss of 41,700 jobs. The consensus expectation was for a gain of approximately 15,000. A RainbowStats regression estimated from March 2022 through July 2026, conditioned on U.S. payroll growth, implied a Canadian increase of approximately 32,100. The August Canadian outcome was about −1.93 model standard errors from that estimate.
The Canadian Labour Force Survey and the U.S. establishment survey are not directly comparable. They cover different populations and use different designs. Canada should therefore be treated as corroborating context, not as a replication of the American survey.
Even with that caution, the contrast is striking: a surprisingly strong U.S. report arrived alongside a surprisingly weak Canadian one.
Putting the discrepancies on a bell curve
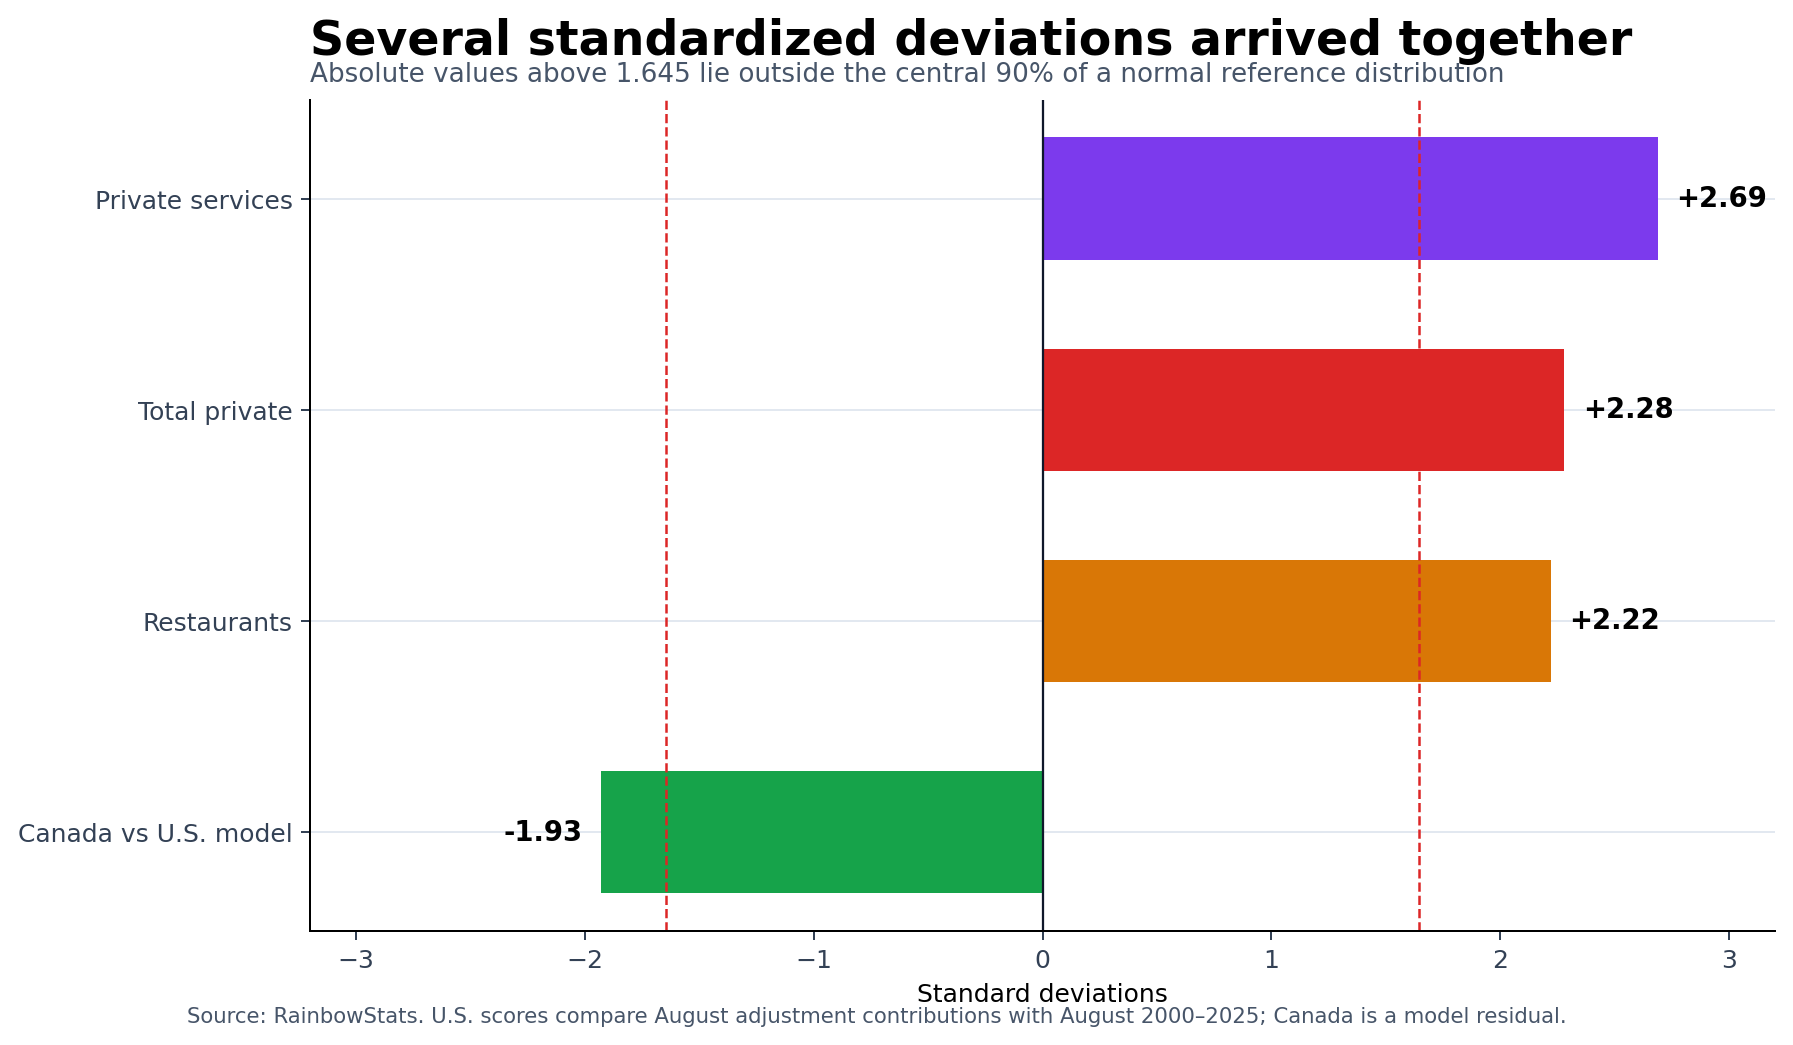
Standardizing the four discrepancies lets us compare quantities originally measured in different units. The resulting absolute z-scores are 2.28 for total private employment, 2.69 for private services, 2.22 for restaurants and 1.93 for the Canadian model residual.
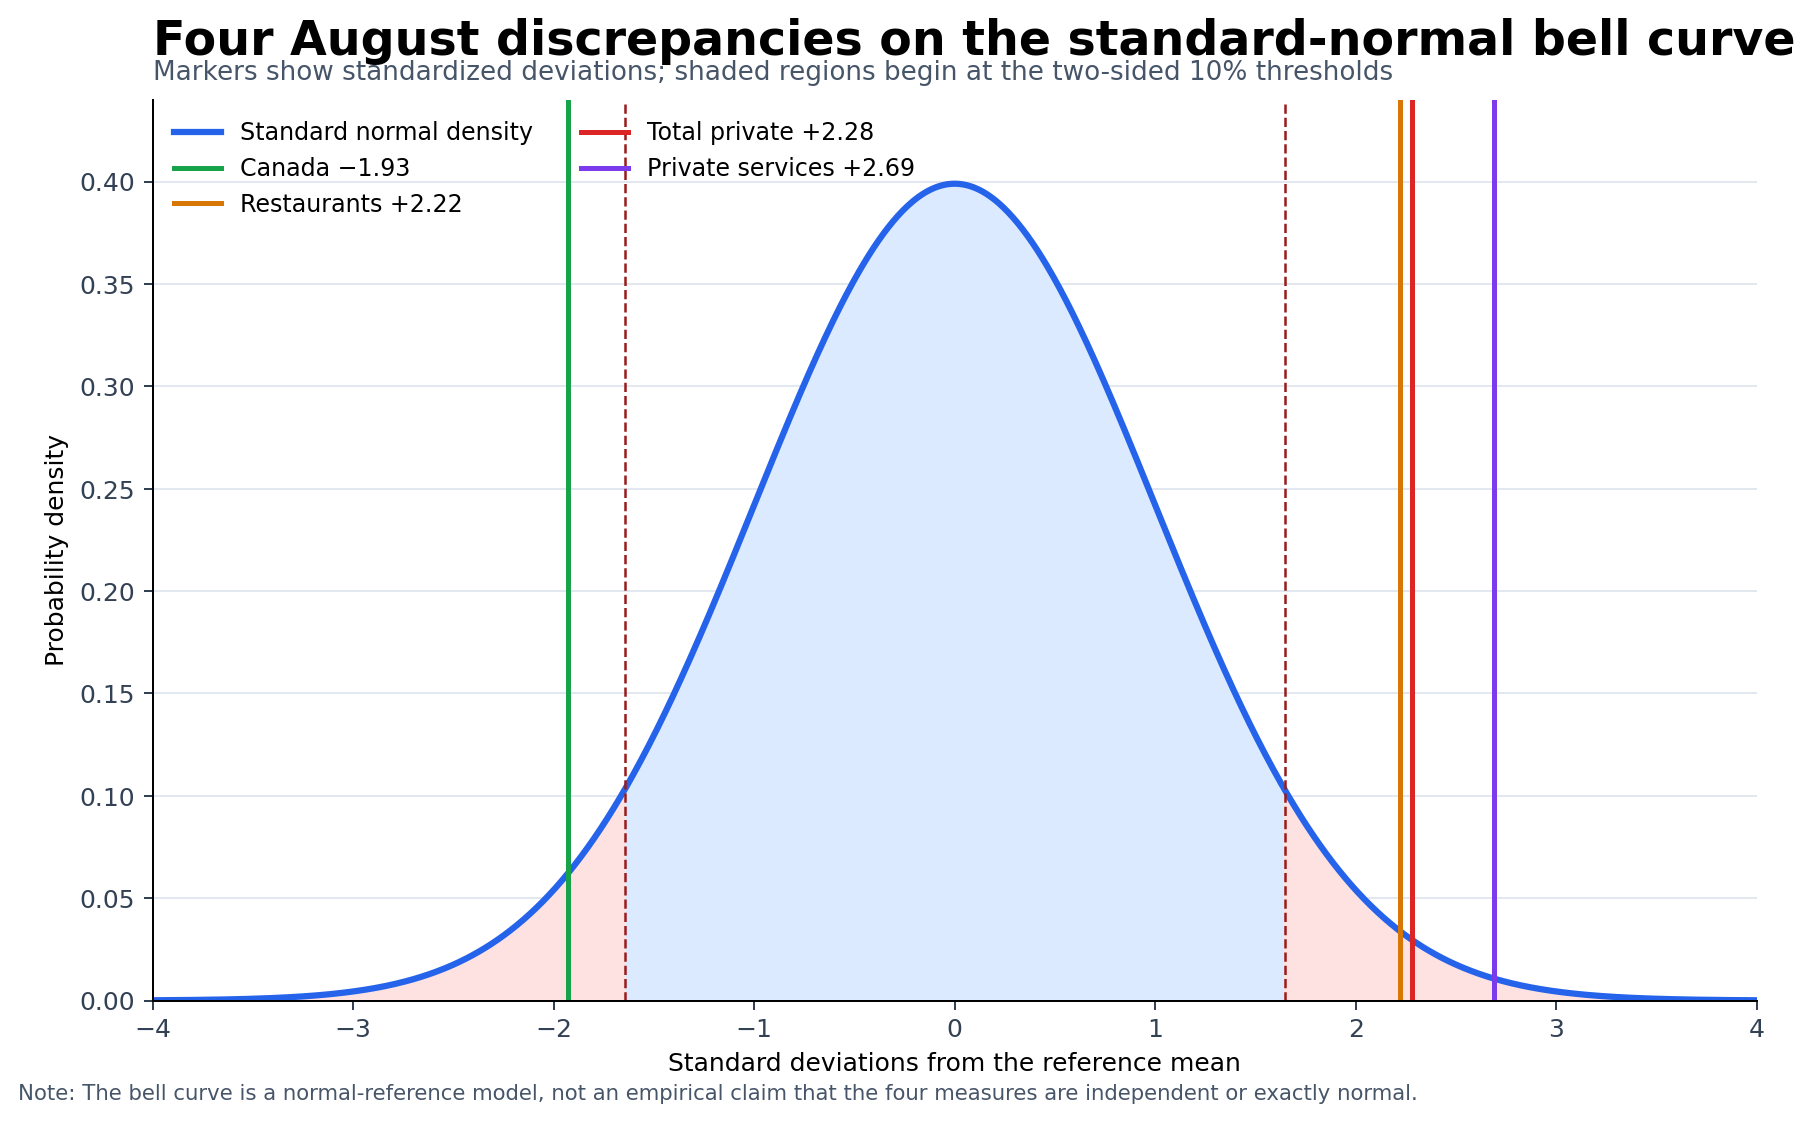
Under a standard-normal reference distribution, the corresponding two-sided marginal tail probabilities are approximately 2.26% for total private, 0.72% for private services, 2.64% for restaurants and 5.36% for Canada.
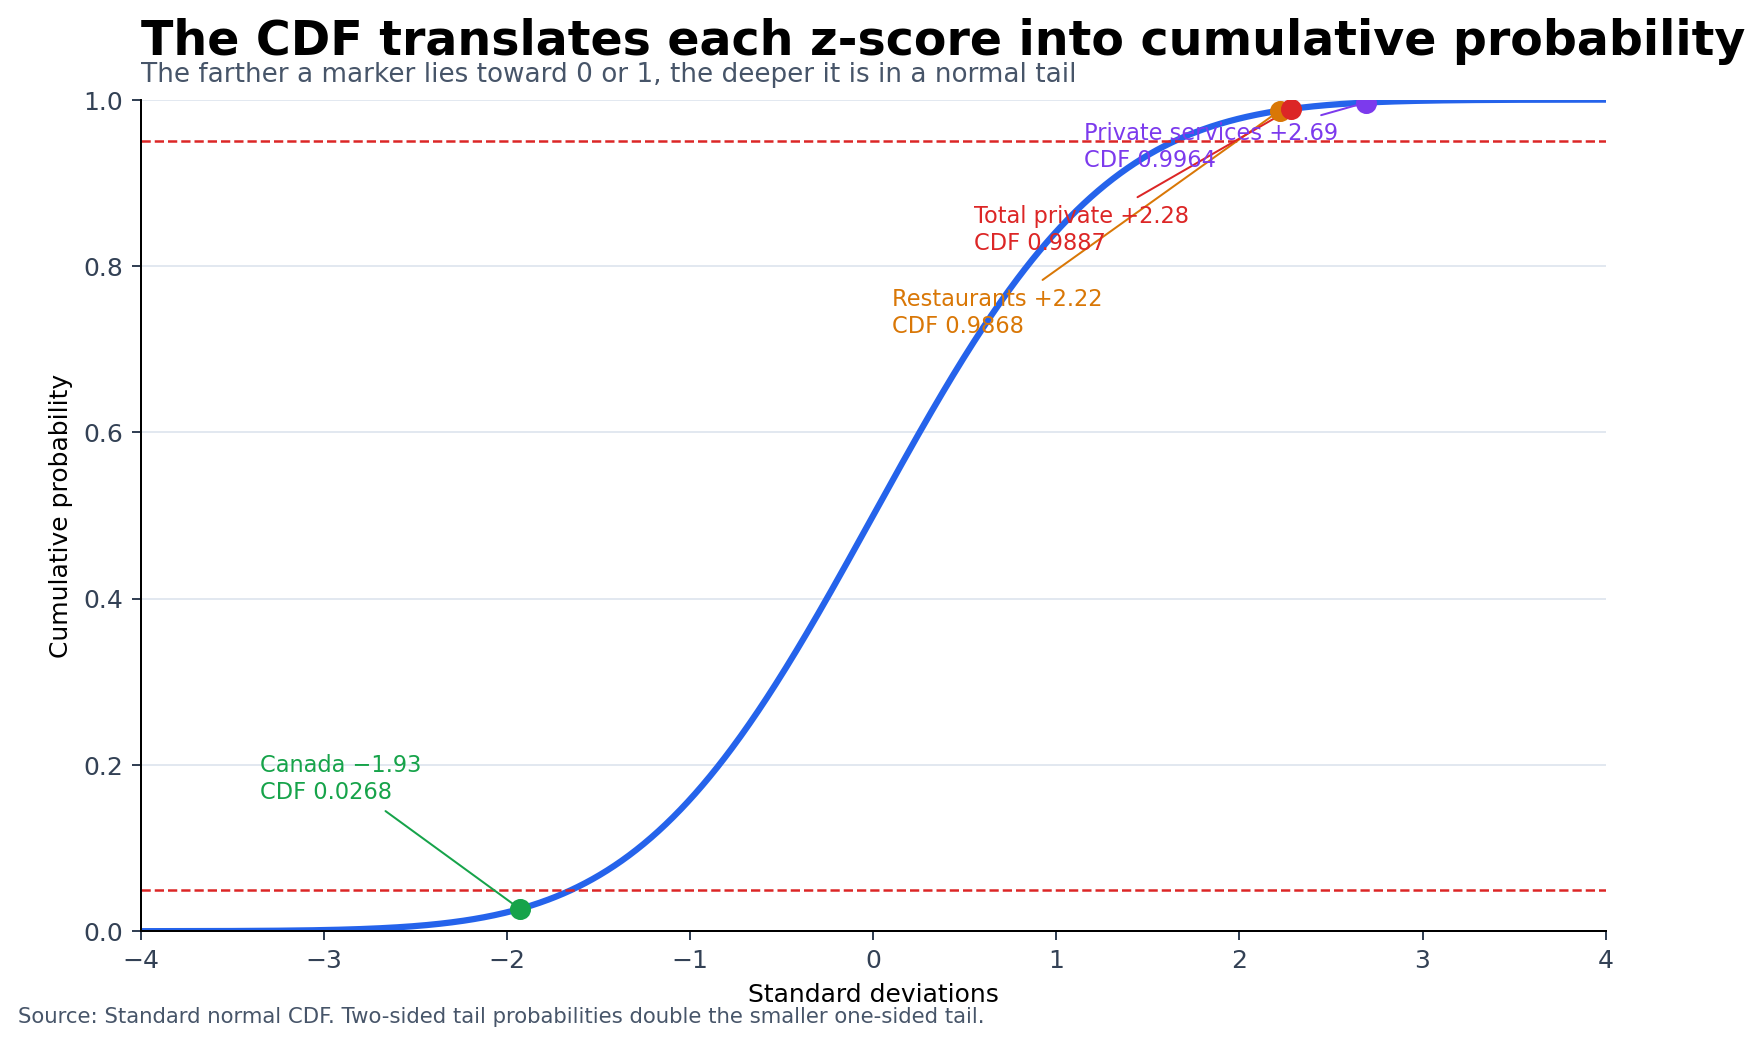
The cumulative distribution function provides another way to see the same information. Total private lies near the 98.87th percentile, private services near the 99.64th, restaurants near the 98.68th, and Canada near the 2.68th percentile.
What if the four observations were correlated?
The simplest calculation would assume independence and multiply the four two-sided tail probabilities:
≈ 0.000023% ≈ 1 in 4.3 million
But the independence assumption is plainly unrealistic. Total private employment contains private services, and private services contain restaurants. Canada is separate, but it is economically connected to the United States.
We therefore added a deliberately substantial correlation assumption. Let every pair have correlation ρ = 0.5 under a multivariate-normal reference model. An equicorrelated standard-normal vector can be represented as:
Here, F and the four ε terms are independent standard-normal variables. Conditional on F = f, the four tail events are independent. For thresholds t = (2.28, 2.69, 2.22, 1.93), the two-sided joint probability is:
Numerical integration at ρ = 0.5 gives:
Correlation makes clusters of extreme observations much more likely than independence does. Even so, under this illustrative model, simultaneous absolute deviations of this magnitude occur only about once in 3,250 observations.
That number must not be oversold. The equal-correlation assumption is a sensitivity test, not an estimated covariance matrix. The U.S. categories are nested, the sample of historical August observations is small, and the probability changes if we condition on the observed directions. The calculation does not produce a formal probability that the payroll report is “wrong.” It shows that the collection of discrepancies is difficult to dismiss as four unrelated pieces of ordinary noise.
The correct conclusion is scrutiny, not accusation
The BLS estimates that the 90% confidence interval around a monthly establishment-survey change is approximately ±122,000. Applied mechanically to the reported 162,000, that produces a plausible range from about 40,000 to 284,000. The consensus forecast of 54,000 lies inside that interval.
BLS also explains that the newest estimates are preliminary. The prior two months are revised as additional establishment reports arrive and seasonal factors are recalculated. Indeed, this release revised June and July upward by a combined 55,000 jobs. The annual benchmark later reanchors the survey to unemployment-insurance tax records.
So the defensible conclusion is not that August employment failed to rise. It probably did. The defensible conclusion is that the reported magnitude depended unusually heavily on seasonal adjustment, was concentrated in a few industries and lacked confirmation from several adjacent indicators.
One oddity can be noise. Two can be coincidence. Four deserve attention.
Replicate the analysis
Open the complete RainbowStats analysis
The complete script produces one 23-panel slideshow containing the raw-versus-adjusted comparisons, sector decomposition, model cross-checks, bell curve, CDF, and joint-probability analysis.
Sources and notes
- U.S. Bureau of Labor Statistics, Employment Situation — August 2026
- BLS full release and technical notes
- ADP National Employment Report — August 2026
- Canada August employment report summarized by Reuters
- BLS CES series accessed through FRED; RainbowStats calculations use current-vintage data.
This analysis does not claim that the preliminary payroll report is false. It identifies an unusual cluster of results and specifies how that conclusion was reached. The next two monthly revisions and the annual benchmark will provide the real test.
We fully expect there will be revisions.