The Binary_Split command identifies structural breaks, or
regime shifts, in the relationship between two time series.
The algorithm recursively partitions the sample into periods where a simple
regression provides the best fit, allowing users to see how relationships
change through time.
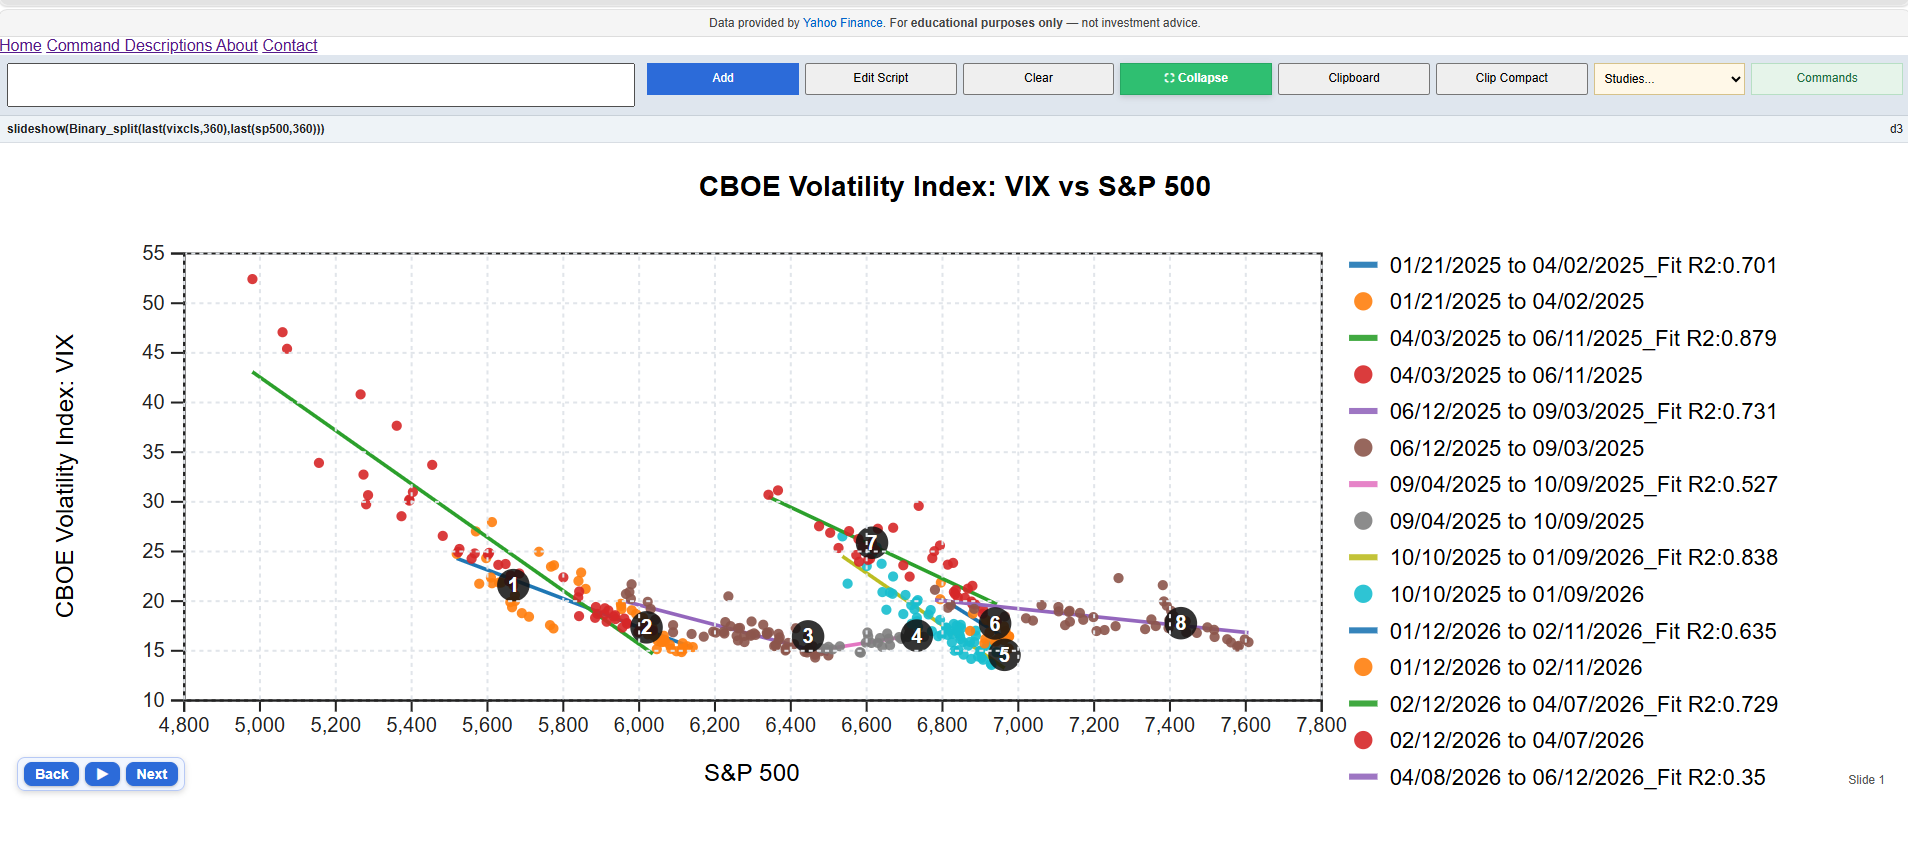
binary_split(last(vixcls,360),last(sp500,360))This example examines the relationship between the CBOE Volatility Index (VIX) and the S&P 500 over the last 360 observations. The routine detects periods where the volatility-equity relationship changed significantly and estimates a separate regression for each regime.
binary_split(dependentSeries, explanatorySeries)The command requires two time series of the same frequency and date range. The first series is treated as the dependent variable, while the second series is used as the explanatory variable.
The command produces two complementary panels.
The routine begins by evaluating every possible split date and selecting the breakpoint that minimizes the combined sum of squared residuals from two separate regressions. The same process is then applied recursively to each sub-period, producing a binary tree of regime changes.
To prevent overfitting, each regime must contain a minimum number of observations (currently 30).
Binary Split is an exploratory diagnostic tool. Breakpoints indicate statistically meaningful changes in a relationship but do not establish causation. Results should be interpreted alongside economic reasoning, sample size, data quality, and other relevant factors.
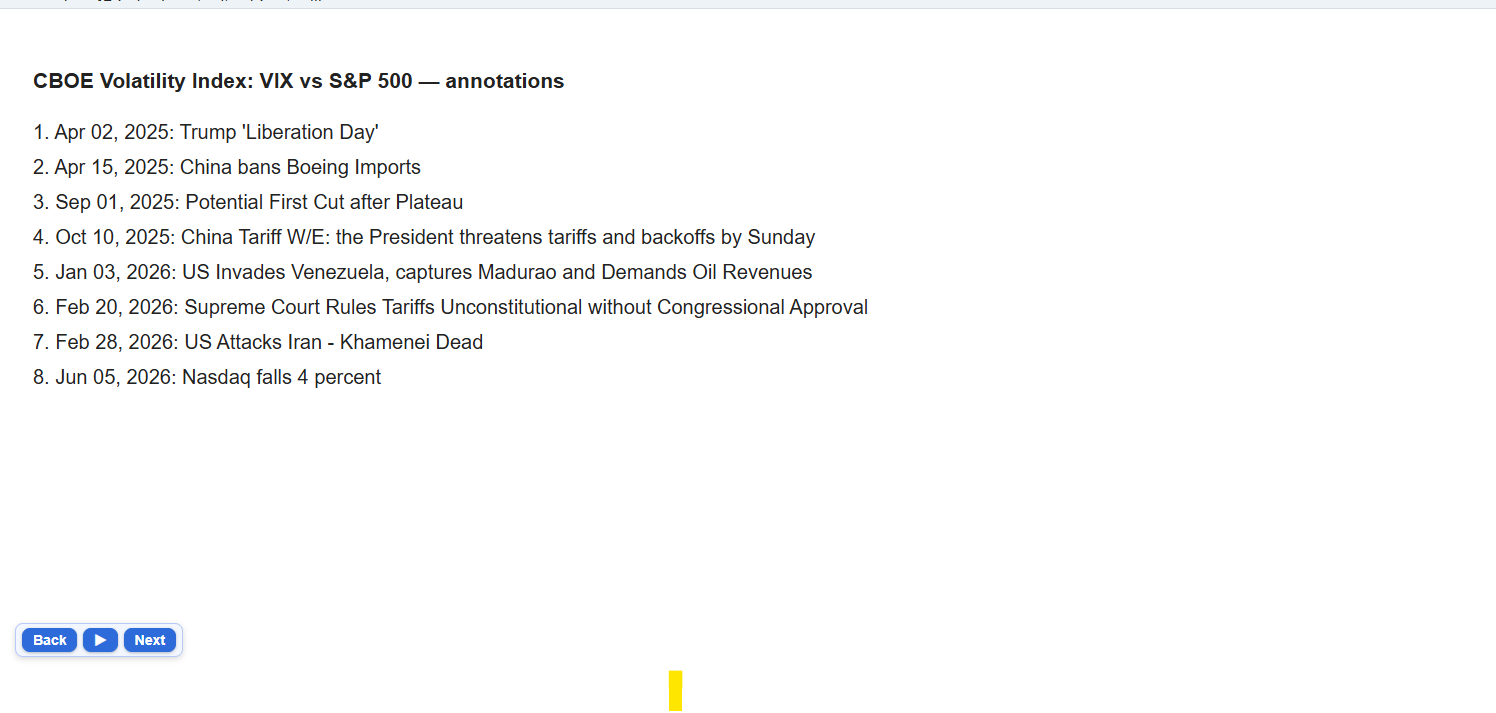
The command is especially effective when viewed through the
slideshow() function, which allows users to step through each
identified regime and its associated annotations.