Home | Command Reference | Run Example
The discriminant command compares two time series and builds a
regime-classification view. It separates observations into low-regime and
high-regime groups, then displays the resulting distributions as an overlaid
histogram.
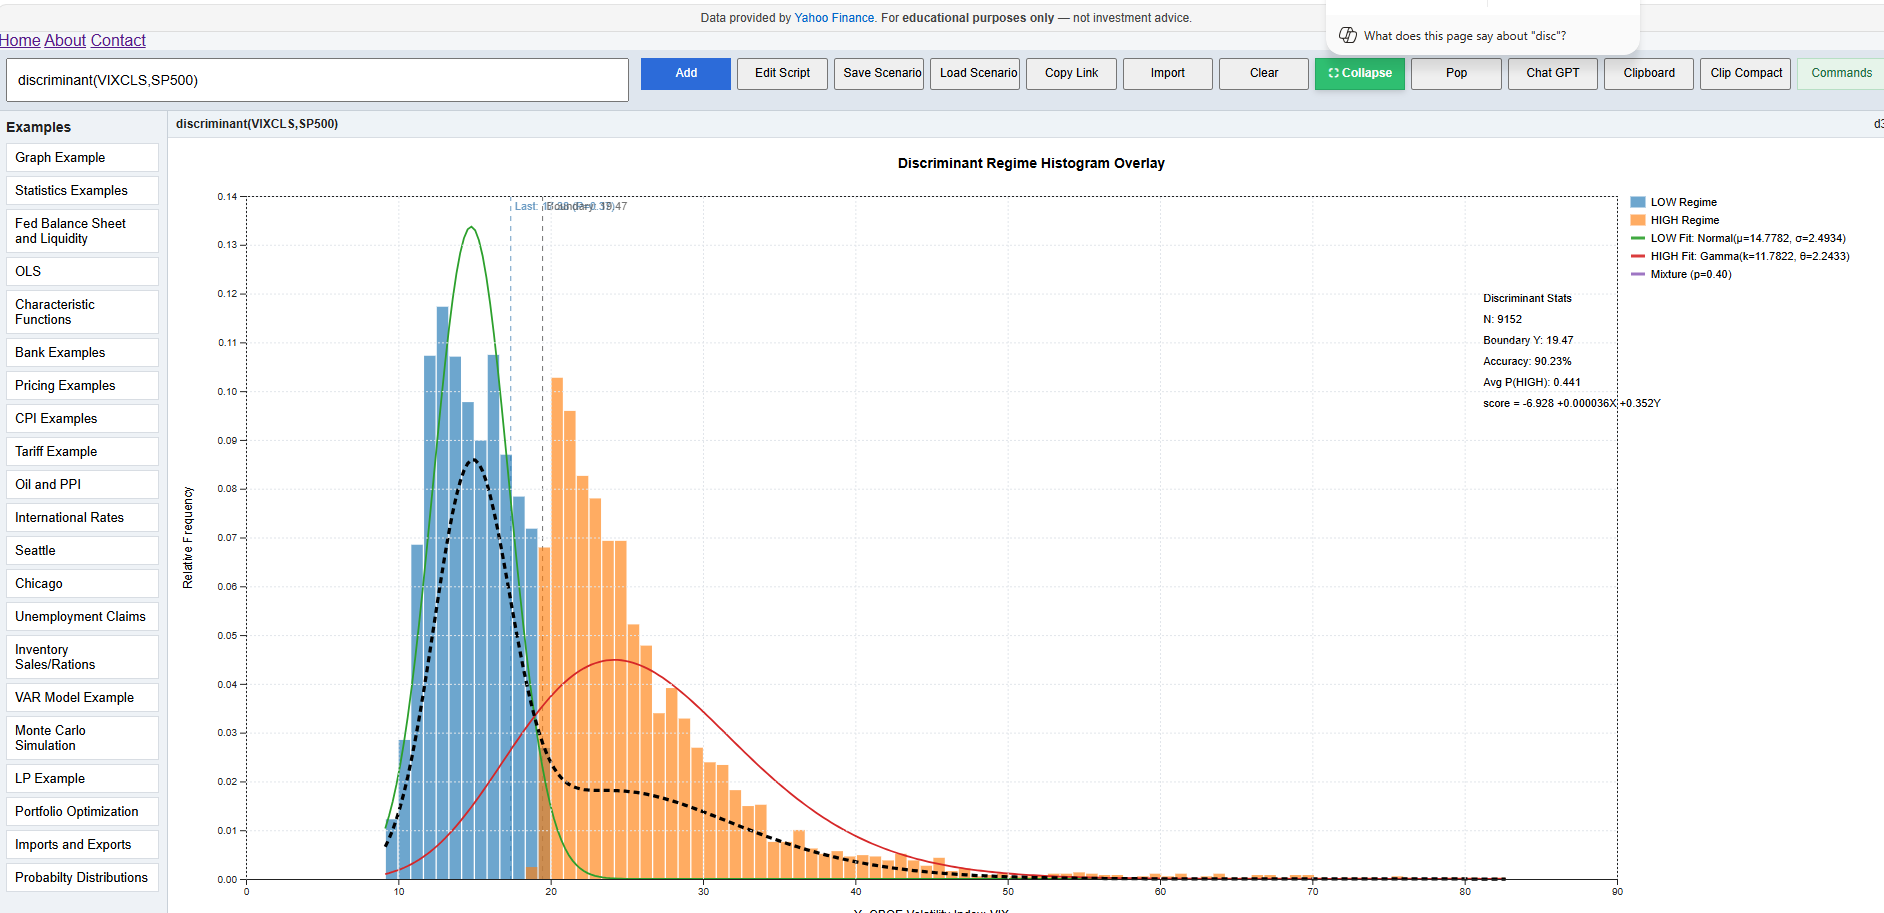
discriminant(VIXCLS,SP500)
This example compares the VIX index with the S&P 500 and estimates a boundary that separates lower-volatility and higher-volatility regimes.
discriminant(seriesX, seriesY)
The first argument is the explanatory or classification series. The second argument is the comparison series used in the analysis.
The command produces a discriminant regime histogram overlay including:
The blue bars represent observations classified into the lower regime. The orange bars represent observations classified into the higher regime. The fitted curves show the approximate distribution of each group.
The vertical boundary line marks the estimated cutoff between regimes. Values on one side are more likely to belong to the low regime, while values on the other side are more likely to belong to the high regime.
In financial data, this can help identify whether one series behaves differently under different market conditions. For example, using VIX and S&P 500 data, the command can show how market behavior changes when volatility moves from a lower regime into a higher regime.
The discriminant command is exploratory. It is useful for visualizing regime separation, but the results should be interpreted alongside economic reasoning, sample size, and data quality.