The huber_regression command estimates a robust linear relationship between time series using Huber loss minimization.
Unlike ordinary least squares (OLS), Huber regression reduces the influence of extreme observations and market shocks, making it more stable when working with volatile financial or economic data.
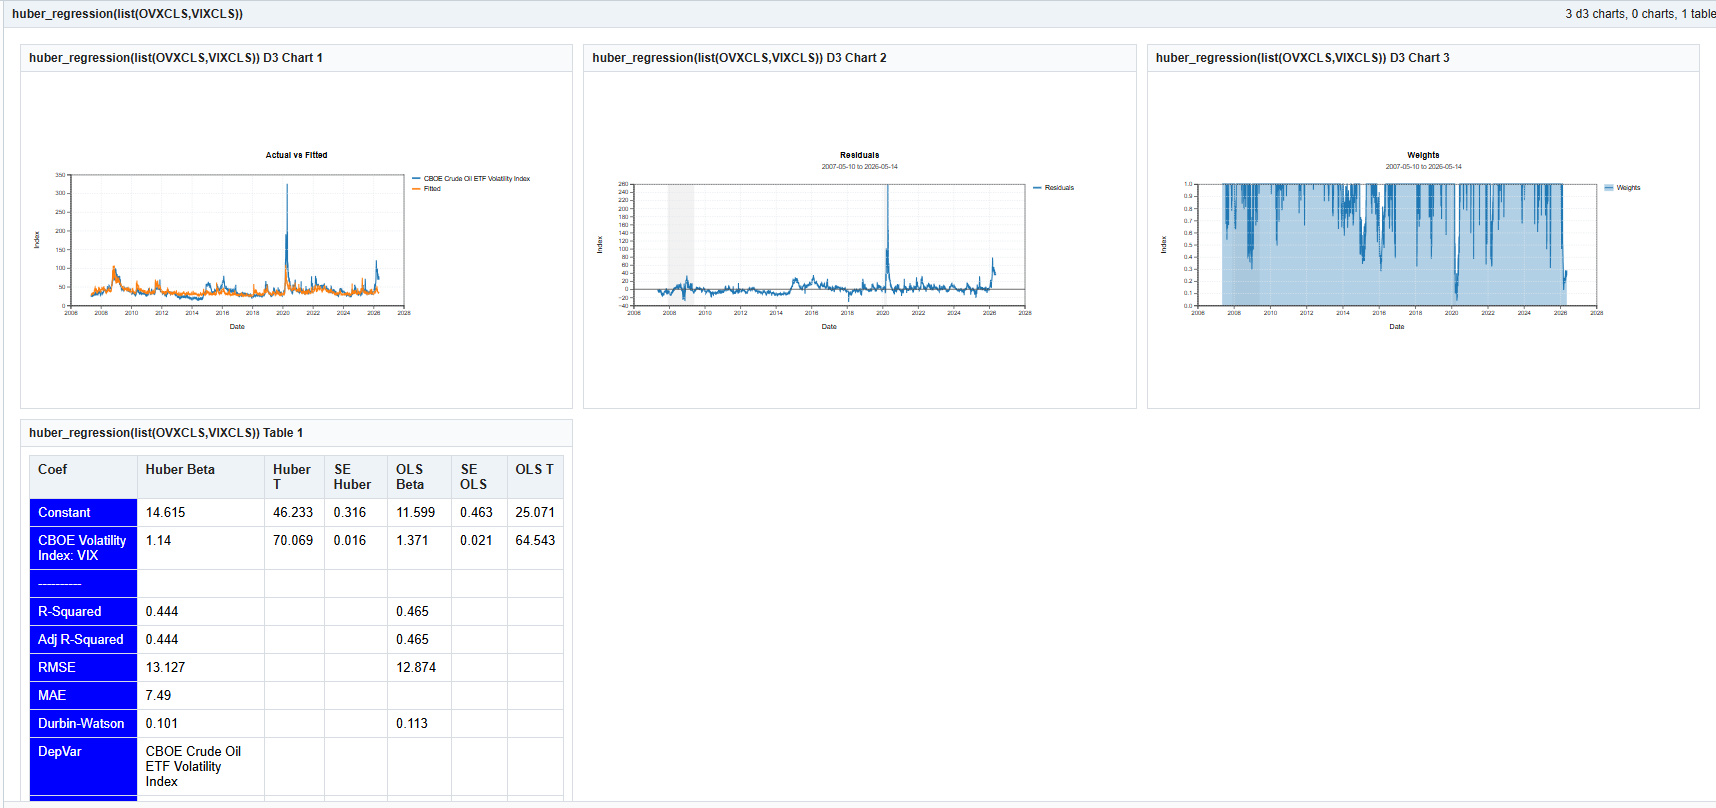
huber_regression(LIST(OVXCLS,VIXCLS))This example estimates the relationship between the CBOE Crude Oil Volatility Index (OVX) and the VIX volatility index using robust regression techniques.
huber_regression(seriesList)The input should be a list of time series. The first series is treated as the dependent variable. The remaining series are explanatory variables. A constant term is added automatically.
The command produces a robust regression panel including:
The Actual vs Fitted chart compares the observed dependent series with the model’s fitted values. A close overlap indicates the regression is capturing much of the movement in the dependent variable.
The Residuals chart displays the remaining unexplained error after fitting the model. Large spikes highlight periods where the relationship temporarily broke down or where markets experienced unusual stress.
The Weights chart is unique to Huber regression. Observations assigned weights near 1.0 are treated normally, while observations with lower weights are partially discounted because they are considered outliers or unusually influential points.
Huber regression combines properties of ordinary least squares and least absolute deviation estimation. For small residuals it behaves similarly to OLS, but for extreme residuals it reduces sensitivity to outliers.
This makes Huber regression particularly useful for:
Comparing the Huber coefficients with the OLS coefficients can reveal how much influence extreme events had on a traditional regression fit.
Huber regression is designed for exploratory and diagnostic analysis. While more robust than ordinary least squares, results should still be interpreted with attention to sample selection, structural breaks, serial correlation, and economic context.