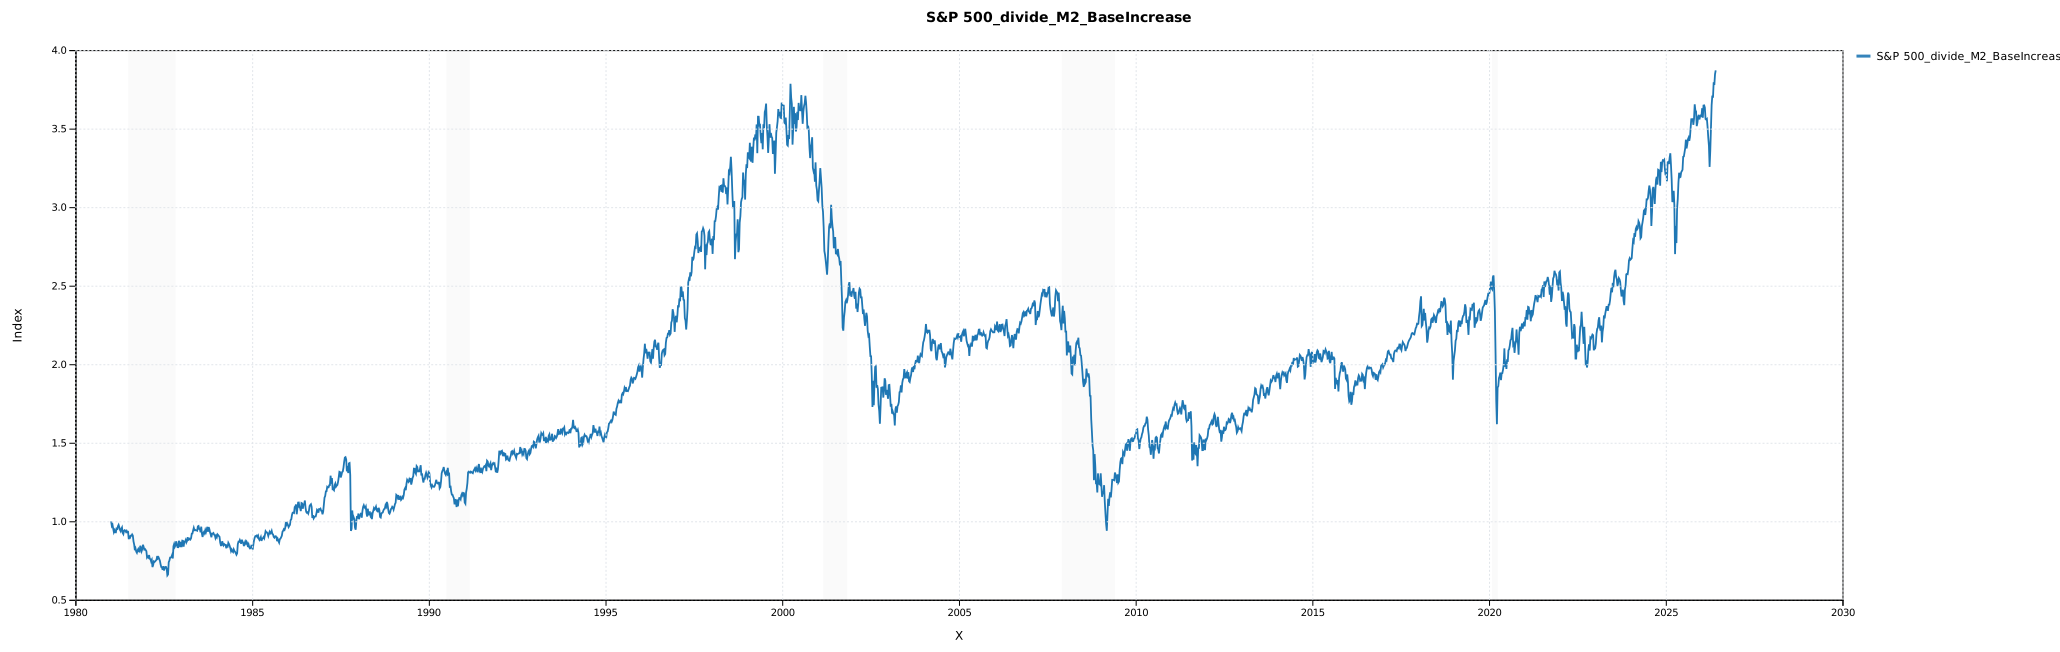
Many valuation arguments begin with a simple observation: the S&P 500 has risen sharply relative to M2. From that chart alone, it is tempting to conclude that equities are far too expensive.
That may be too simple. The S&P 500 is not only a claim on money supply. It is also a claim on corporate earnings power. Over long periods, corporations retain a large share of after-tax profits, and corporate treasury policy can return capital through buybacks rather than dividends. Tax law and investor preferences also matter: capital appreciation is often more tax efficient than current dividend income.
To look at the problem from the corporate side, I use a cumulative measure of adjusted corporate retained capital. The measure combines two FRED series:
W274RC1Q027SBEA: undistributed corporate profits with inventory valuation and capital consumption adjustments.NCBCEBQ027S: nonfinancial corporate business corporate equities; liability, transactions.The first series measures profits after tax that are not distributed as dividends. The second series captures net equity issuance or retirement. When corporations retire equity, often through buybacks, the series is generally negative. Combining the two gives a rough measure of retained corporate capital after accounting for net equity issuance and retirement.
Because these flow series are reported at annual rates, I divide the combined flow by four before accumulating it quarterly.
netIssuance = NCBCEBQ027S
re = W274RC1Q027SBEA
adjre = (re + netIssuance) / 4
Cum_re = ex(adjre, cumulative)
The chart below compares the indexed S&P 500-to-M2 ratio with cumulative adjusted corporate retained capital. The binary split regression does not force one line through the entire period. Instead, it looks for regimes where the relationship changes.
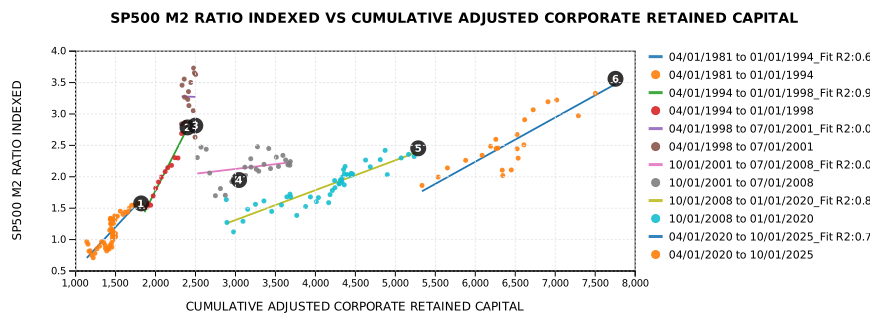
This is the key point: a weak full-sample relationship does not necessarily mean corporate retained capital is irrelevant. It may mean the market repeatedly changes the multiple it assigns to that capital.
The split regression shows that the relationship is interrupted by major market and economic regimes: the dot-com period, the 2008 financial crisis, COVID, and changes in monetary and tax policy. In some periods the relationship is strong. In others, the market detaches from the retained-capital base.
The simple conclusion is that the S&P 500 did not rise because M2 rose alone. Money supply and liquidity matter, but equity values also reflect decades of corporate profits, retained capital, buybacks, and changing tax incentives.
A chart of the S&P 500 divided by M2 can be useful, but it is incomplete. It looks only at the money side of the equation. Equity valuation also depends on what corporations earned, retained, and returned to shareholders.
The fuller picture is that M2 provides part of the liquidity background, while retained corporate capital provides part of the fundamental base. The market then decides, regime by regime, what multiple to assign to that base.
Valuation arguments based only on M2 miss this important corporate-capital channel.
netIssuance=NCBCEBQ027S
re=W274RC1Q027SBEA
adjre=(re+netIssuance)/4
Cum_re=ex(adjre,cumulative)

l=same_date_range(list(cum_re,sp500))
bs=ex(l,binary_split:1:0)
ex(bs,0)

l2=add_item(l,WM2NS)
l2logDiff=logdiff(l2)
l2logDiff=set_first(l2logdiff,1)
tr=mvtransfer_function(l2logdiff,6,4)
slideshow(tr)

poly_scatter(sp500,cum_re,2)
poly_scatter(sp500/WM2NS,cum_re/WM2NS,2)

sp_m2=SP500/WM2NS
index_sp_m2=to_index(sp_m2)

lm2=same_date_range(list(cum_re,index_sp_m2))
bsm2=ex(lm2,binary_split:1:0)
bsm2=ex(bsm2,0)

set_Title(bsm2,SP500_M2_Ratio_vs_Adjusted_Corporate_Retained_Capital)
set_XAxis(bsm2,Cumulative_Adjusted_Corporate_Retained_Capital)
set_YAxis(bsm2,SP500_M2_Ratio_Indexed)