
The November elections are approaching, so we built a RainbowStats tool that analyzes economic performance by political party and presidency for any selected economic data series.
Click here for sample studies.
Each example uses a simple regression model with party and president as explanatory variables. The beta coefficient represents the average value of the selected economic series during each presidency or party period.
This type of analysis is useful, but it must be interpreted carefully. Historical context matters. For example, in industrial production, President Coolidge has a positive coefficient, but that gain is dramatically offset by the collapse under President Hoover
Was Hoover responsible? Not entirely. He was constrained by the economic thinking of his time. President Roosevelt’s rebound reflects a different policy regime, including New Deal programs, Keynesian-style demand support, and the large increase in armaments production before and during World War II.
These three charts are useful for political economic analysis. First, we examine changes in Industrial Production.
Industrial Production by President
Industrial Production by Party
Industrial Production Separation / Discriminant by Party

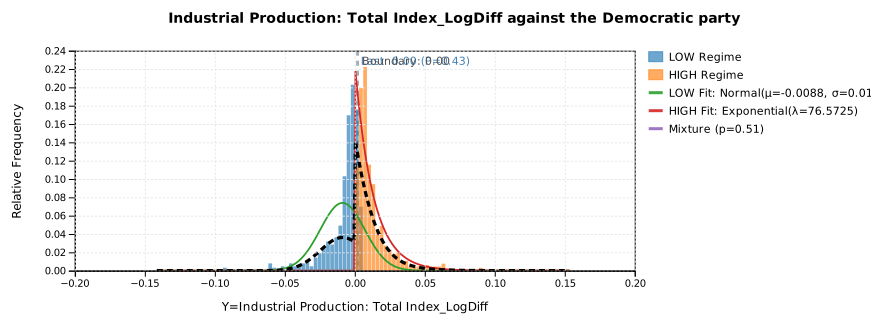
Next, we look at the unemployment rate. In this case, we analyze the level of unemployment rather than the change.
Industrial Production by President
Industrial Production by Party
Industrial Production Separation / Discriminant by Party


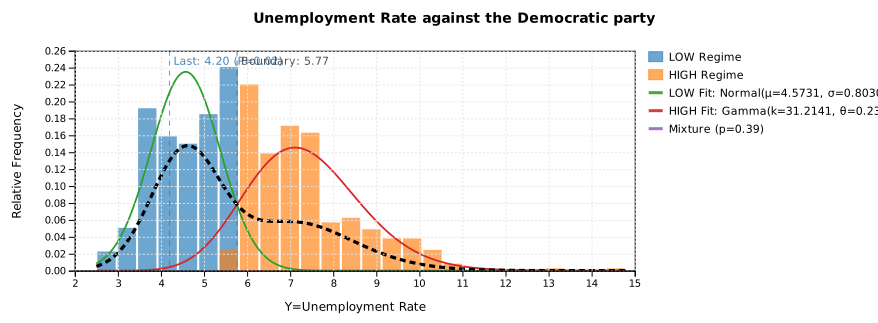
Using RainbowStats, any user can quickly measure the economic performance of a time series by presidency or political party. The tool is simple, but the interpretation requires judgment. Always consider the historical context behind the numbers.
Enjoy!